Fig. B.1.
Download original image
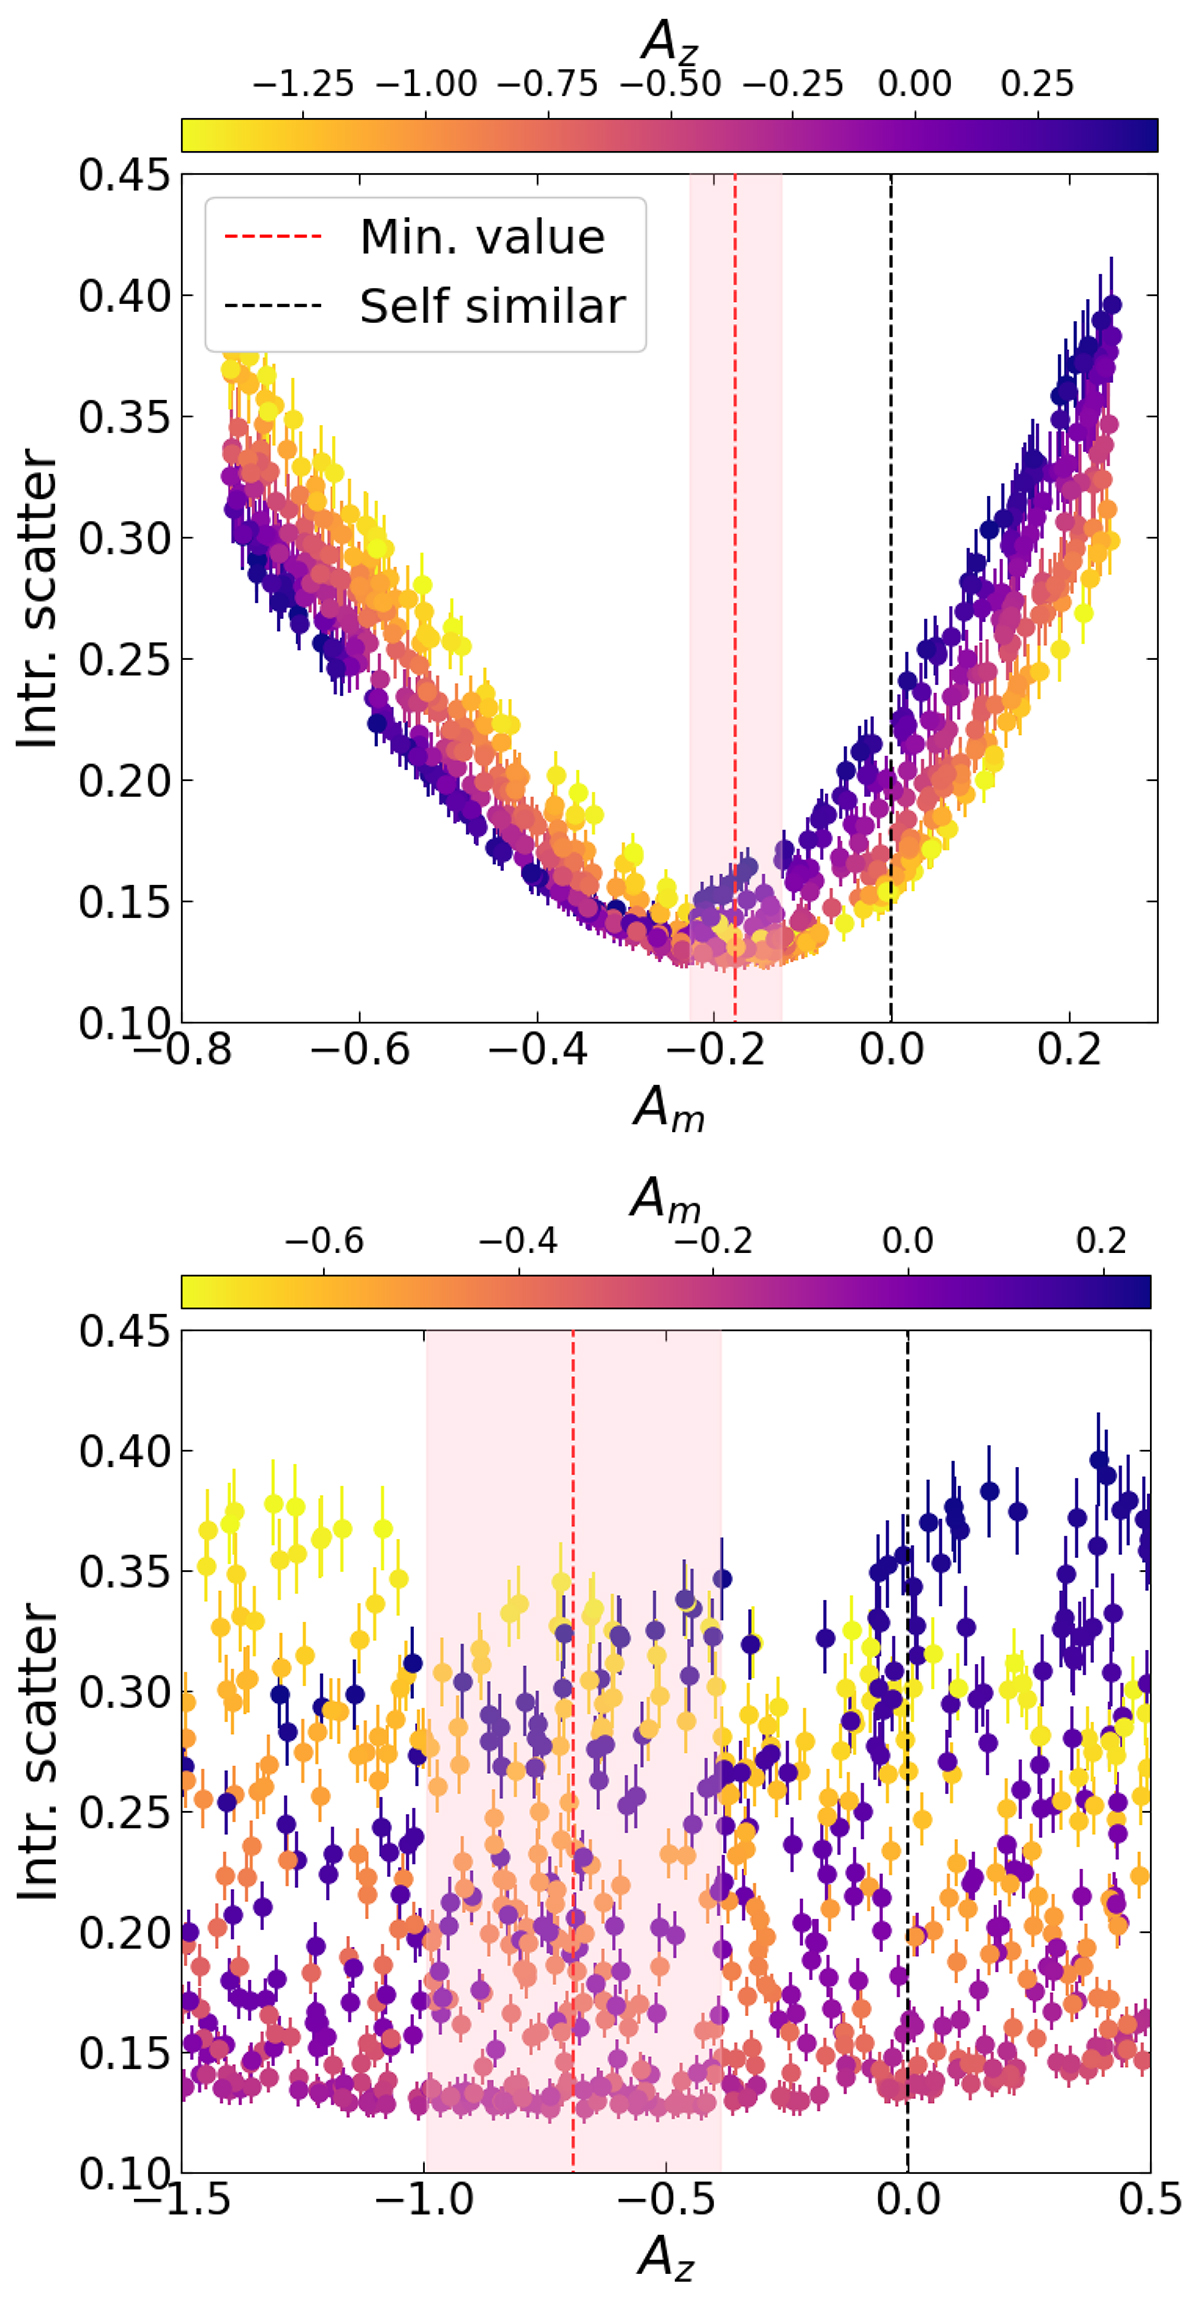
Constraints to both residual mass (Am) and redshift (Az) dependencies, as defined in Eq. B.1. In the figure, we plot the distribution of the intrinsic scatter of the combined HIGHMz – REXCESS – ESZ sample, as a function of Am (top) and Az (bottom). In the upper panel, measured points are colour coded according Az, while in the lower one according to Am values. Vertical red lines mark the positions of the two minimum values, while black ones are predictions from the self-similar scenario (i.e. Am = Az = 0).
Current usage metrics show cumulative count of Article Views (full-text article views including HTML views, PDF and ePub downloads, according to the available data) and Abstracts Views on Vision4Press platform.
Data correspond to usage on the plateform after 2015. The current usage metrics is available 48-96 hours after online publication and is updated daily on week days.
Initial download of the metrics may take a while.