Open Access
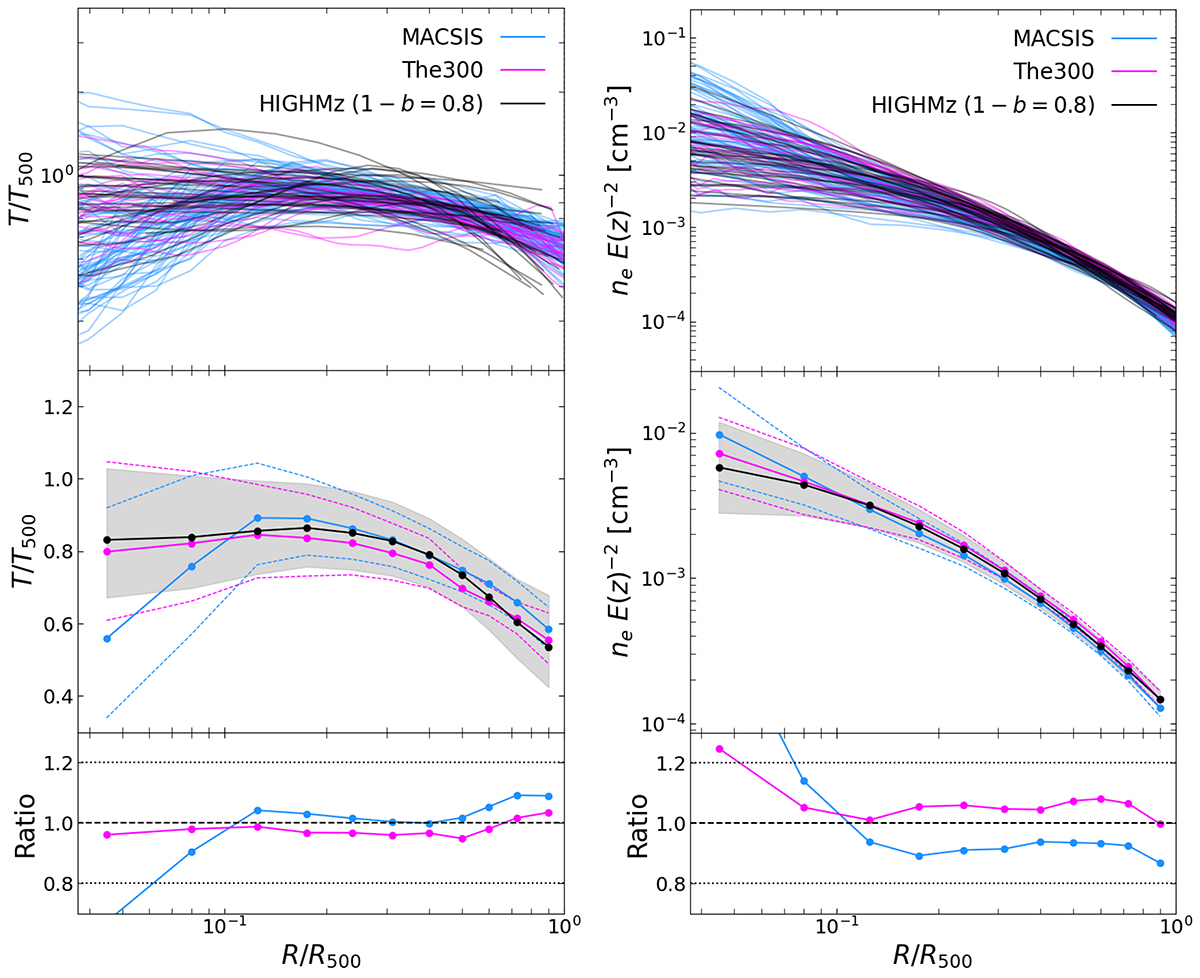
Fig. A.1.
Download original image
Comparison of temperature (left) and density (right) profiles of MACSIS (light blue) and The300 (violet) clusters, with respect to HIGHMz ones (black). Upper, central and lower panels show the same information as in Fig. 7.
Current usage metrics show cumulative count of Article Views (full-text article views including HTML views, PDF and ePub downloads, according to the available data) and Abstracts Views on Vision4Press platform.
Data correspond to usage on the plateform after 2015. The current usage metrics is available 48-96 hours after online publication and is updated daily on week days.
Initial download of the metrics may take a while.