Fig. 13.
Download original image
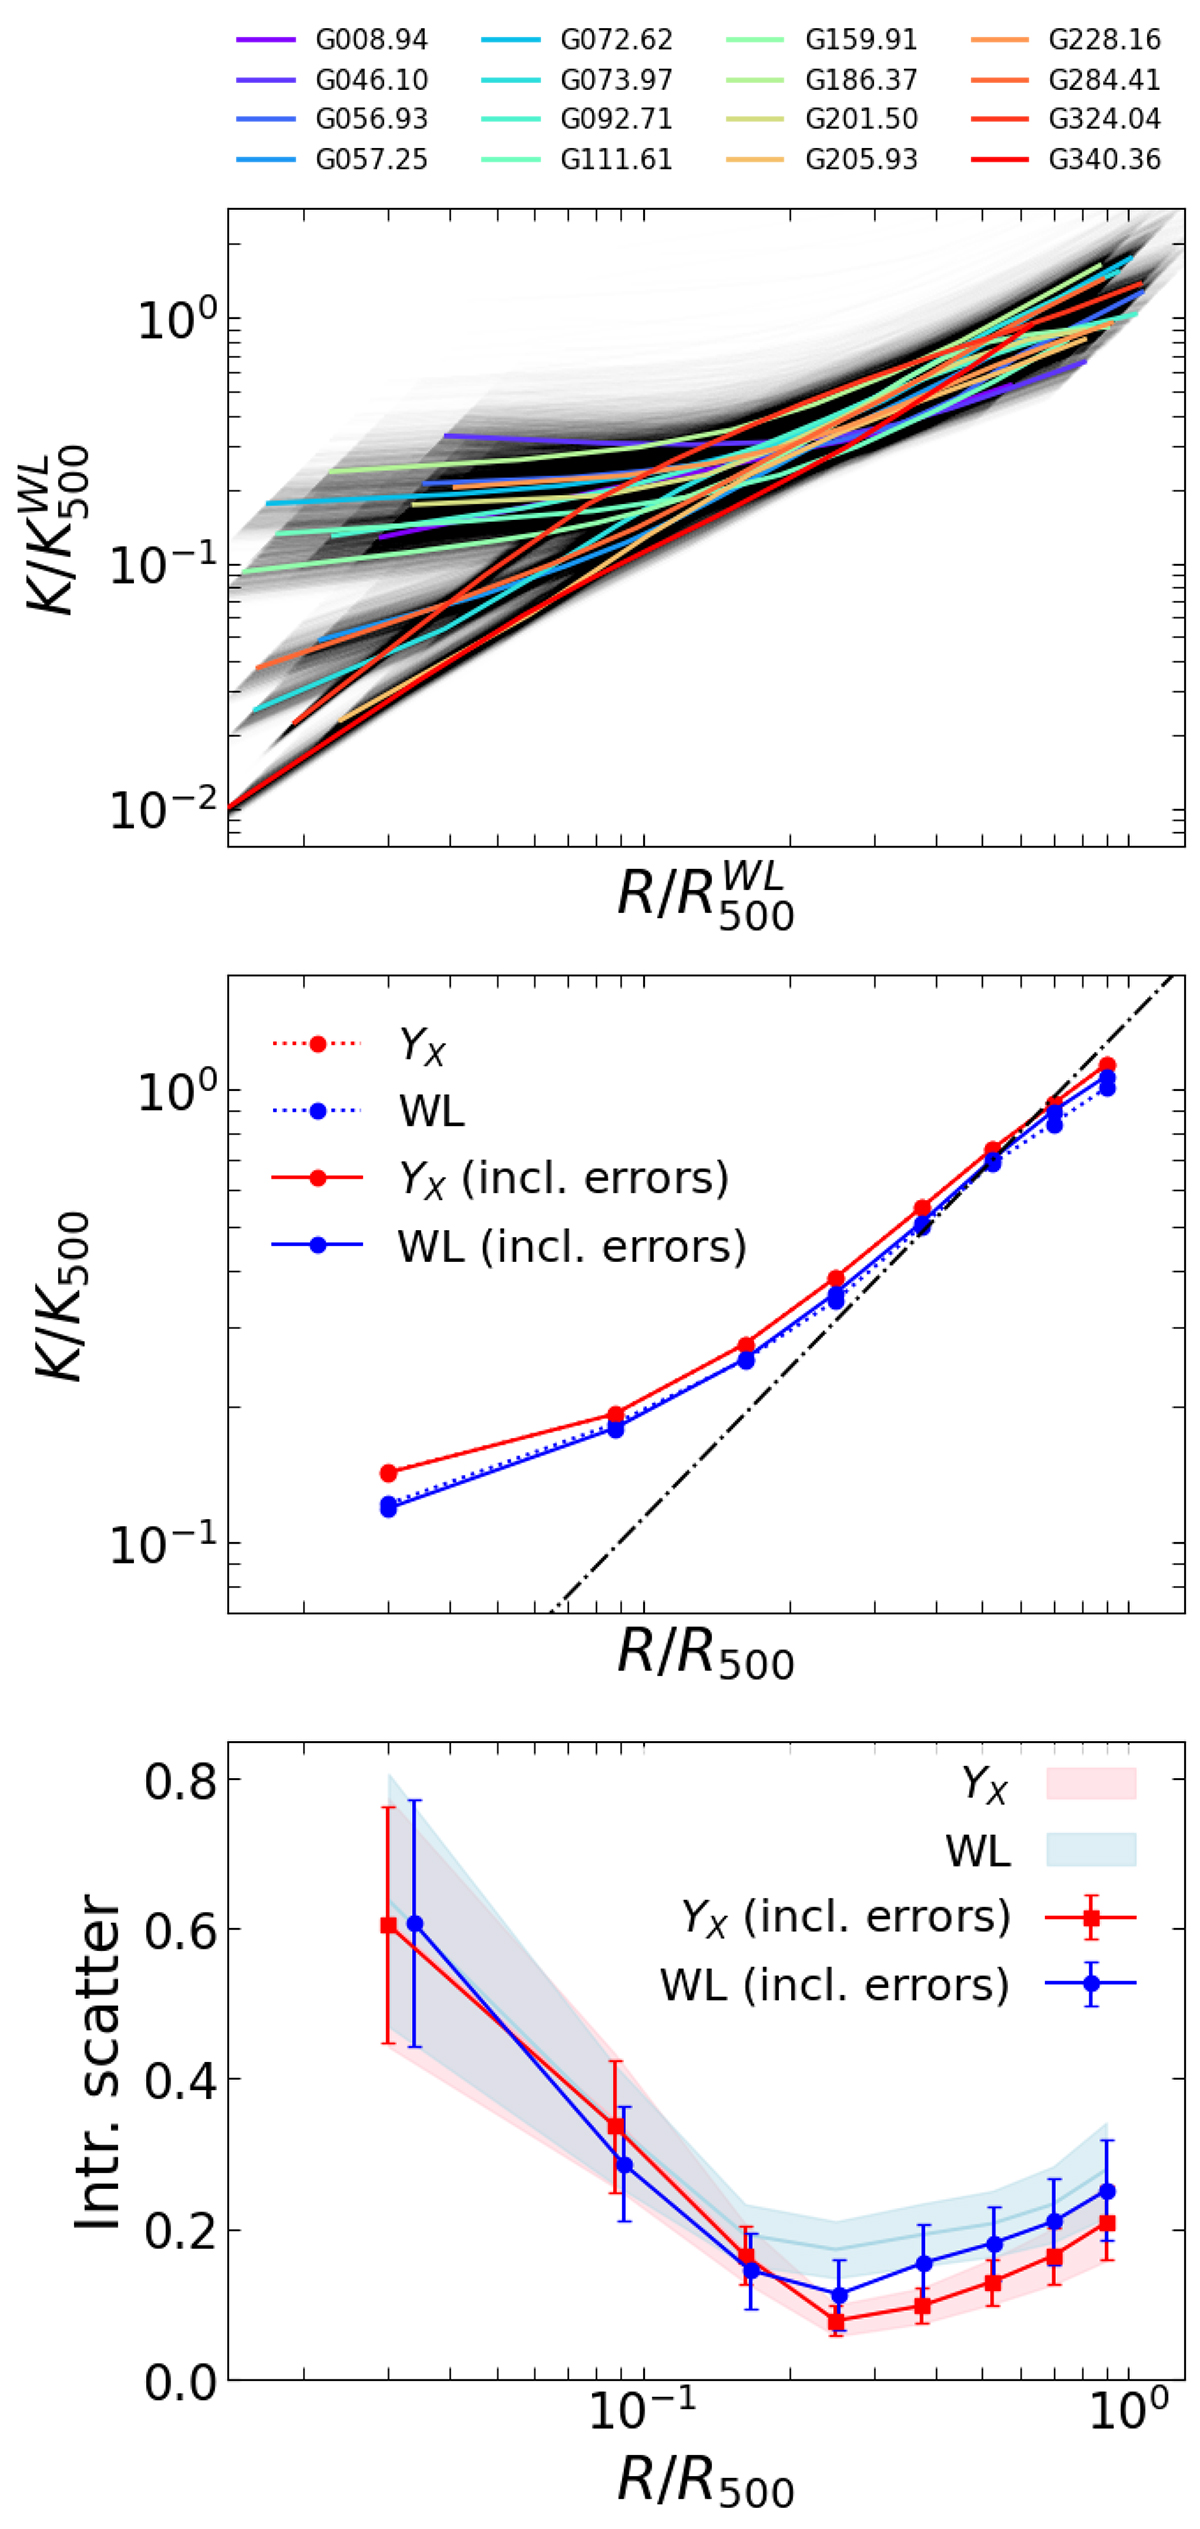
Rescaling using weak-lensing masses. From top to the bottom: (i) entropy profiles of the sub-sample of 16 clusters with weak-lensing masses available, scaled using ![]() , where shaded grey lines show the impact of accounting for statistical errors on
, where shaded grey lines show the impact of accounting for statistical errors on ![]() in the rescaling, as described in the text; (ii) median entropy profiles, obtained using M500YX (red dotted line) and
in the rescaling, as described in the text; (ii) median entropy profiles, obtained using M500YX (red dotted line) and ![]() (blue dotted line) in the rescaling; continuous lines are the measurements after including statistical errors on mass measurements; (iii) same as centre, but for the intrinsic dispersion; here, simple scalings without including errors on mass measurements are shown as shaded areas.
(blue dotted line) in the rescaling; continuous lines are the measurements after including statistical errors on mass measurements; (iii) same as centre, but for the intrinsic dispersion; here, simple scalings without including errors on mass measurements are shown as shaded areas.
Current usage metrics show cumulative count of Article Views (full-text article views including HTML views, PDF and ePub downloads, according to the available data) and Abstracts Views on Vision4Press platform.
Data correspond to usage on the plateform after 2015. The current usage metrics is available 48-96 hours after online publication and is updated daily on week days.
Initial download of the metrics may take a while.