Fig. 12.
Download original image
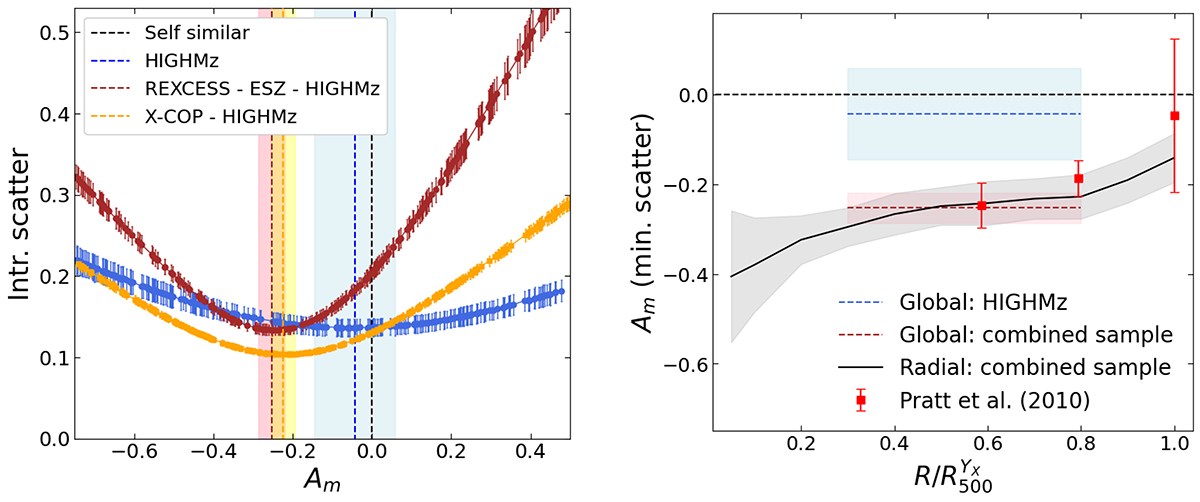
Constraints to the residual mass dependence Am in the entropy rescaling. Left panel: distribution of the intrinsic scatter of different samples as a function of Am, to identify the global (i.e. within [0.3 − 0.8] R500) Am correction (Sect. 5.3.1). Yellow is used for the combined X-COP – HIGHMz sample, brown for REXCESS – ESZ – HIGHMz, while blue for HIGHMz only. Vertical dashed lines and shaded areas mark the positions of the minima, together with their statistical errors. Right panel: radial dependence of the Am values which minimise the scatter of the combined REXCESS – ESZ – HIGHMz sample (Sect. 5.3.2), together with their statistical errors (black solid line and grey shaded area). Shown in brown (blue) is the global measurements using REXCESS – ESZ – HIGHMz (HIGHMz only) sample. In red are results from REXCESS only (Pratt et al. 2010). Both in the left and right panels, black dashed lines are the prediction from self-similar scenario, i.e. Am = 0.
Current usage metrics show cumulative count of Article Views (full-text article views including HTML views, PDF and ePub downloads, according to the available data) and Abstracts Views on Vision4Press platform.
Data correspond to usage on the plateform after 2015. The current usage metrics is available 48-96 hours after online publication and is updated daily on week days.
Initial download of the metrics may take a while.