Fig. 11.
Download original image
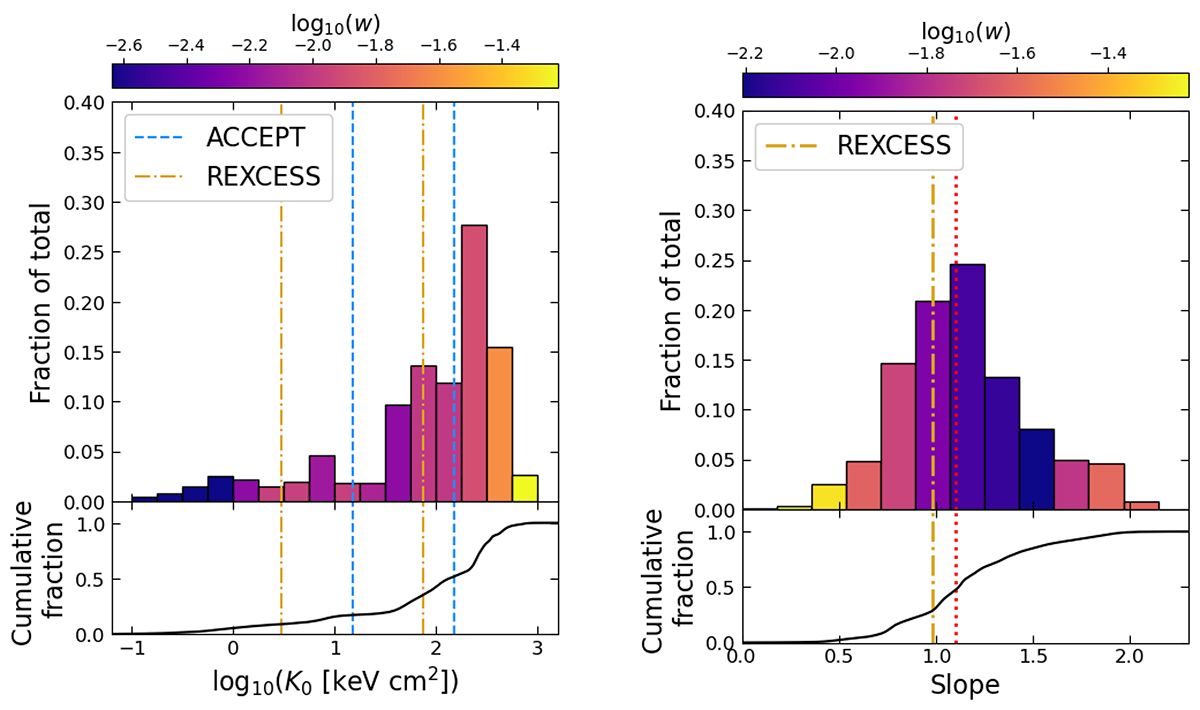
Distribution of central entropies K0 (left) and outer slopes α (right) of the HIGHMz clusters. Plot bars are colour coded according to the median centroid shift w in each bin. Bottom panels are the cumulative distributions of the two histrograms. Blue and golden vertical lines mark the positions of the peaks identified with ACCEPT (Cavagnolo et al. 2009) and REXCESS (Pratt et al. 2010), respectively. The red dotted line on the right is the canonical slope value of 1.1.
Current usage metrics show cumulative count of Article Views (full-text article views including HTML views, PDF and ePub downloads, according to the available data) and Abstracts Views on Vision4Press platform.
Data correspond to usage on the plateform after 2015. The current usage metrics is available 48-96 hours after online publication and is updated daily on week days.
Initial download of the metrics may take a while.