Fig. 2
Download original image
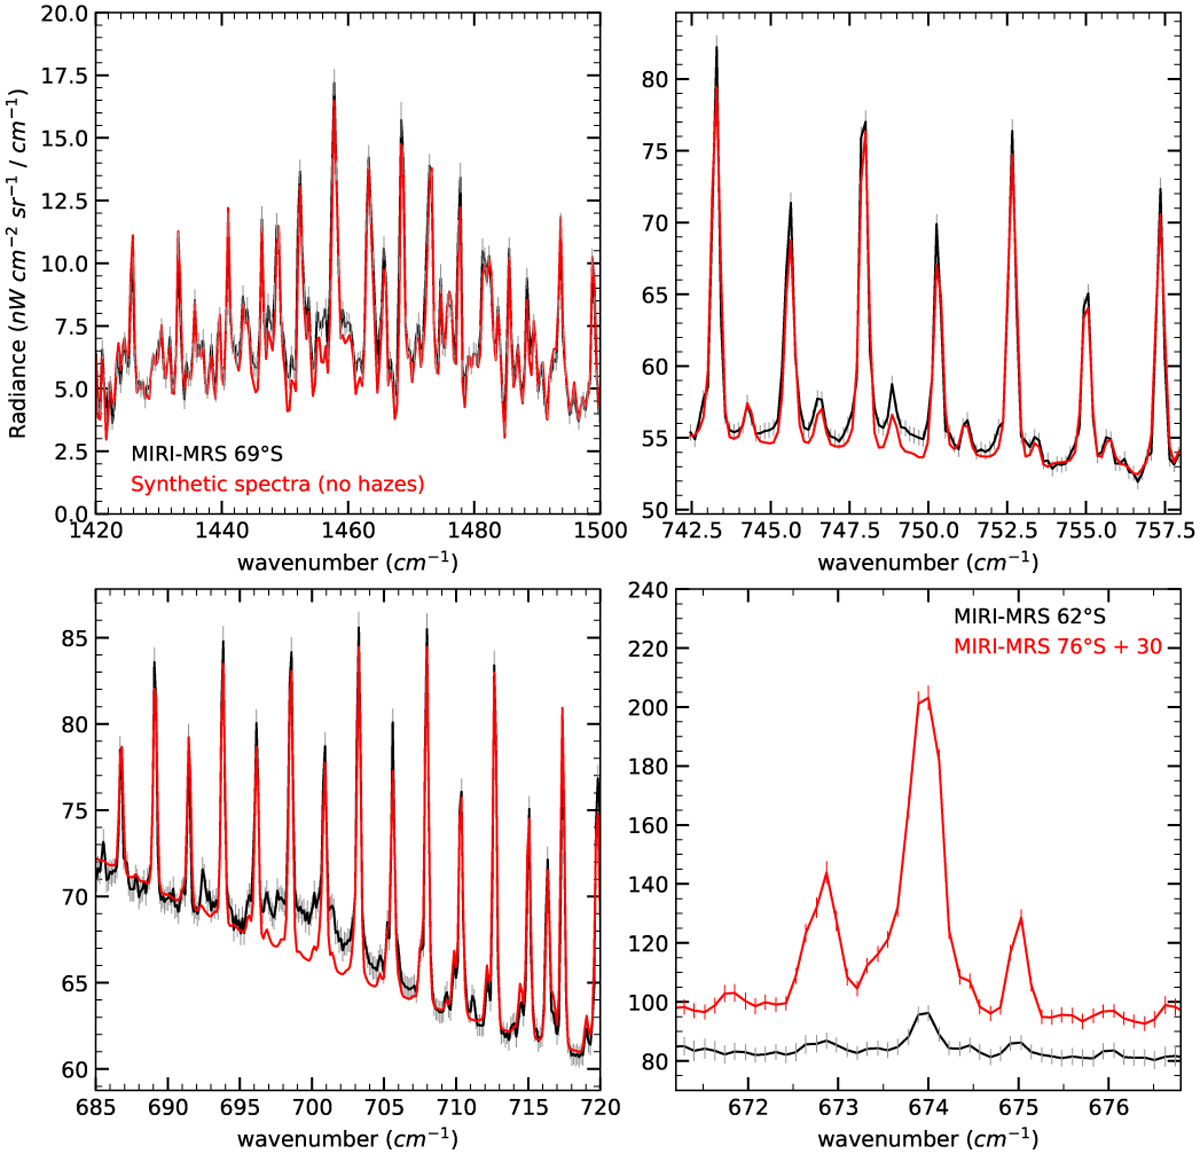
Examples of the spectra used in this work. Top-Left: best fit of the CH4 emission lines at 69°S with a model without stratospheric hazes (red line) compared to the observed spectra (black line), with an aerosol feature centered at 1450 cm−1. Top-Right: best fit of the C2H2 emission lines with a model without stratospheric hazes (red line) compared to the observed spectra (black line), with an aerosol feature centered at 750 cm−1. Bottom-Left: the same as in Top-Right but for the aerosol feature centered at 700 cm−1. Bottom-Right: C6H6 v11 spectra inside the auroral oval (red) and outside the auroral oval (black). The vertical lines show the error of the observations.
Current usage metrics show cumulative count of Article Views (full-text article views including HTML views, PDF and ePub downloads, according to the available data) and Abstracts Views on Vision4Press platform.
Data correspond to usage on the plateform after 2015. The current usage metrics is available 48-96 hours after online publication and is updated daily on week days.
Initial download of the metrics may take a while.