Fig. B.1
Download original image
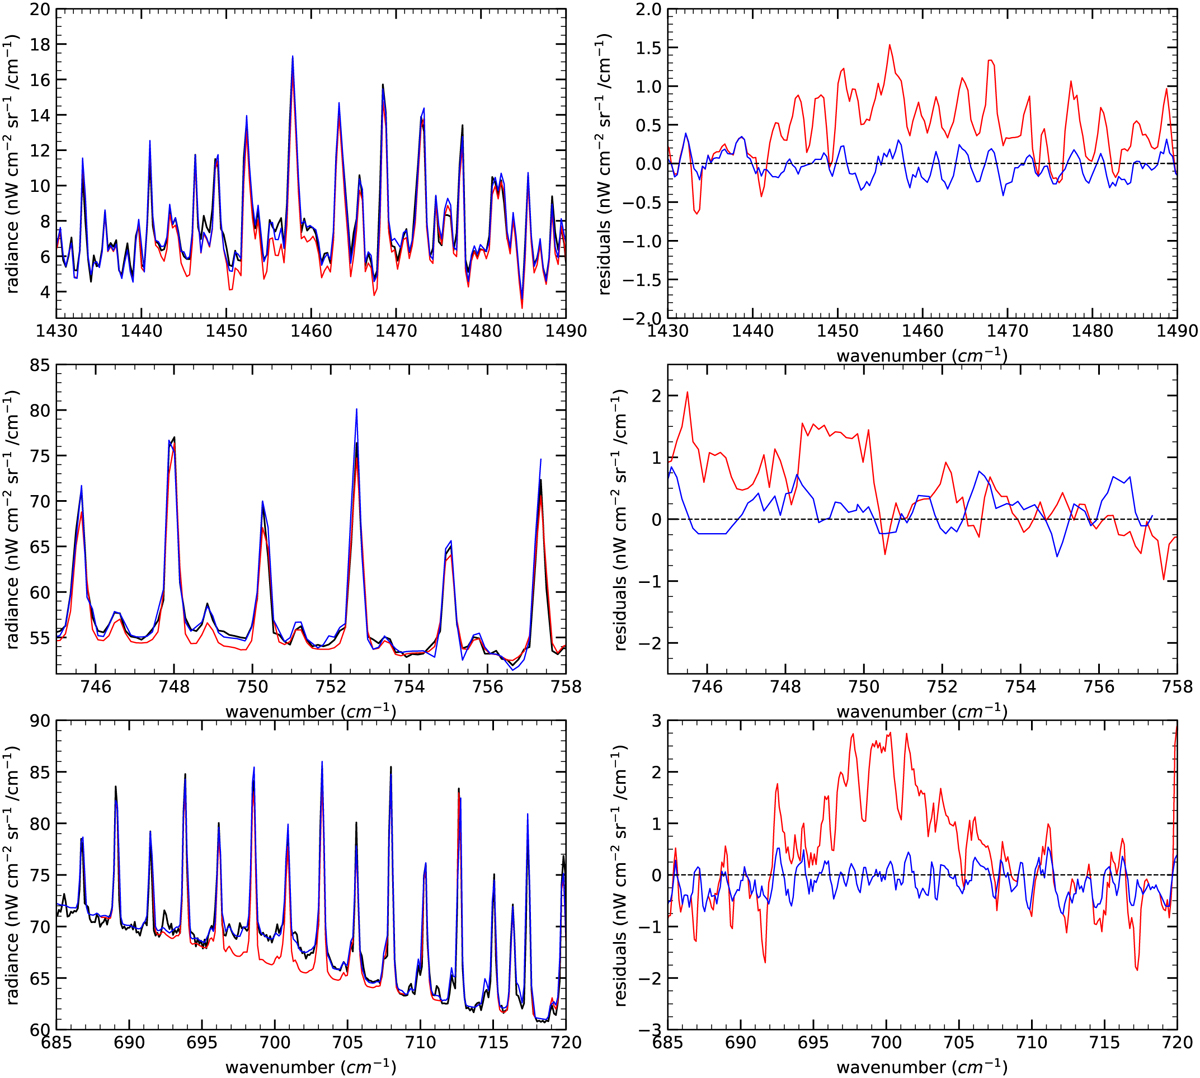
Left: MIRI/MRS latitudinal mean spectra acquired at 69°S (black) compared to the best fit of a spectrum without haze opacity (red) and the best fit of a spectrum with the opacity recovered in Fig. 11 (blue) for the ranges 1420 – 1480 (top), 685 – 720 (medium), and 743–760 (bottom) cm−1. Right: Residuals between the models and the observed spectra for the spectral ranges analyzed.
Current usage metrics show cumulative count of Article Views (full-text article views including HTML views, PDF and ePub downloads, according to the available data) and Abstracts Views on Vision4Press platform.
Data correspond to usage on the plateform after 2015. The current usage metrics is available 48-96 hours after online publication and is updated daily on week days.
Initial download of the metrics may take a while.