Fig. 12
Download original image
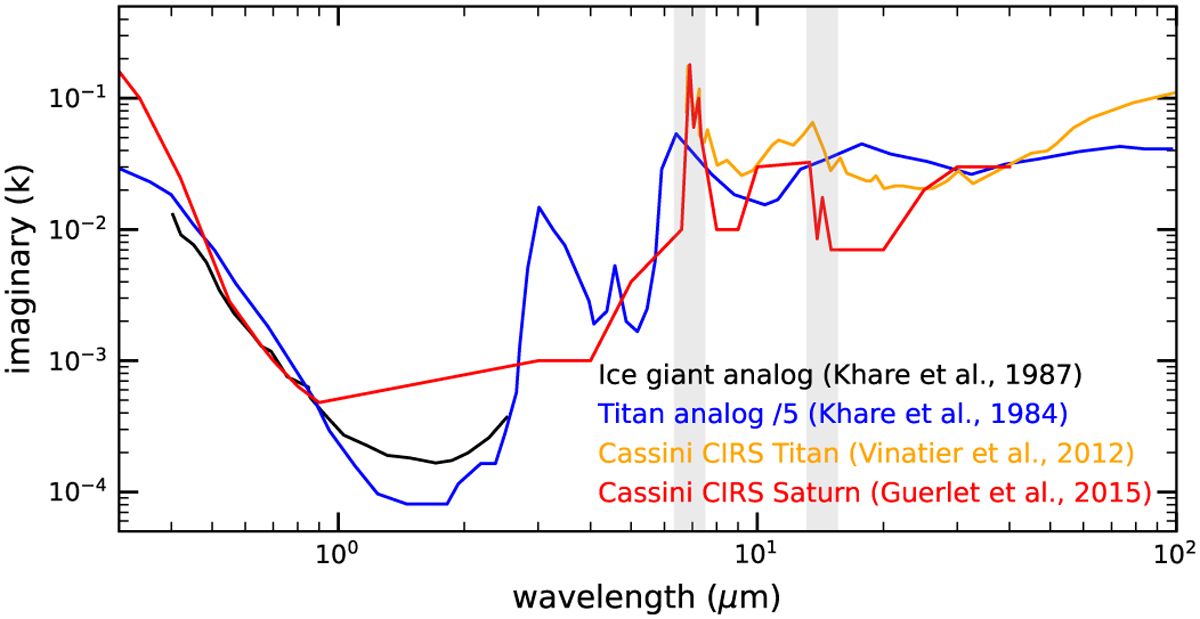
Imaginary part (k) of the refractive index for the aerosols. Jupiter analog experiment (Khare et al. 1987) is shown in black, the tholin experiment (Khare et al. 1984) reduced by a factor of five is shown in blue, the Titan Cassini-CIRS observations (Vinatier et al. 2012) are shown in orange and the Saturn Cassini-CIRS observations (Guerlet et al. 2015) are shown in red. The gray regions mark the spectral region where the aerosols were analyzed in this work.
Current usage metrics show cumulative count of Article Views (full-text article views including HTML views, PDF and ePub downloads, according to the available data) and Abstracts Views on Vision4Press platform.
Data correspond to usage on the plateform after 2015. The current usage metrics is available 48-96 hours after online publication and is updated daily on week days.
Initial download of the metrics may take a while.