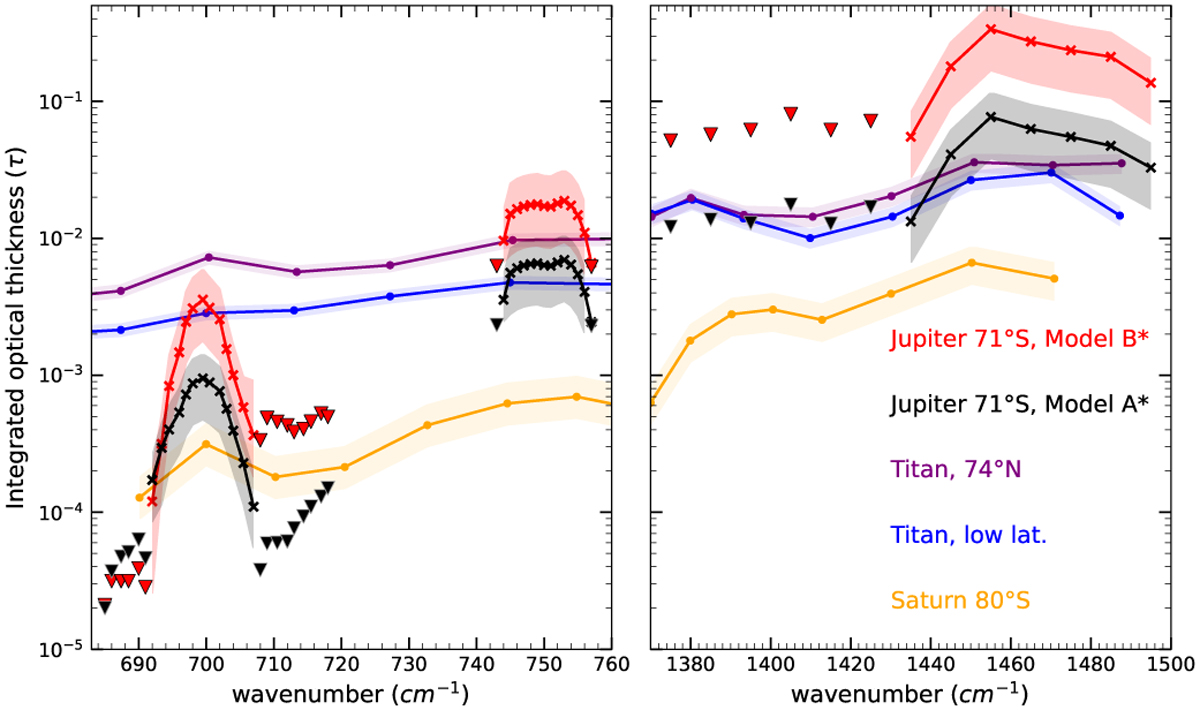
Fig. 11
Download original image
Spectral dependence of the integrated optical depth from 0.4 to 70 mbar for a mean spectrum located at 71°S using model B* (red) and model A* (black), compared to the data from Vinatier et al. (2012) for Titan (integrated between 1.7 and 0.7 mbar) and Guerlet et al. (2015) for Saturn (integrated between 3 and 0.1 mbar) from Cassini/CIRS observations. The shaded areas show the magnitude of the error in each measurement. The upper limits are displayed as triangles.
Current usage metrics show cumulative count of Article Views (full-text article views including HTML views, PDF and ePub downloads, according to the available data) and Abstracts Views on Vision4Press platform.
Data correspond to usage on the plateform after 2015. The current usage metrics is available 48-96 hours after online publication and is updated daily on week days.
Initial download of the metrics may take a while.