Open Access
Fig. 10
Download original image
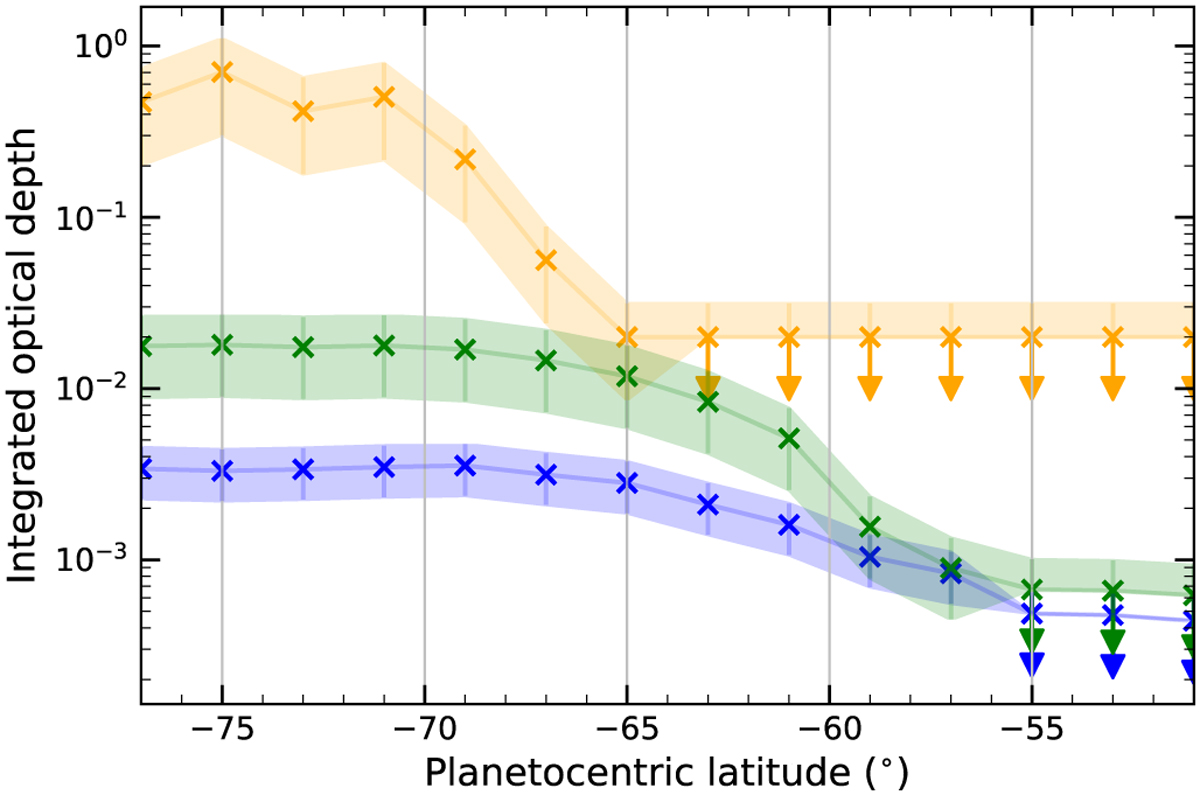
Integrated optical depth over latitude retrieved from model B* for the features located at 700 cm−1 (blue curve), 750 cm−1 (green), and 1455 cm−1 (orange). The colored area shows the confidence interval of our measurements. The arrows mark the upper limit for the latitudes where the aerosol feature was no longer present.
Current usage metrics show cumulative count of Article Views (full-text article views including HTML views, PDF and ePub downloads, according to the available data) and Abstracts Views on Vision4Press platform.
Data correspond to usage on the plateform after 2015. The current usage metrics is available 48-96 hours after online publication and is updated daily on week days.
Initial download of the metrics may take a while.