Open Access
Fig. 5.
Download original image
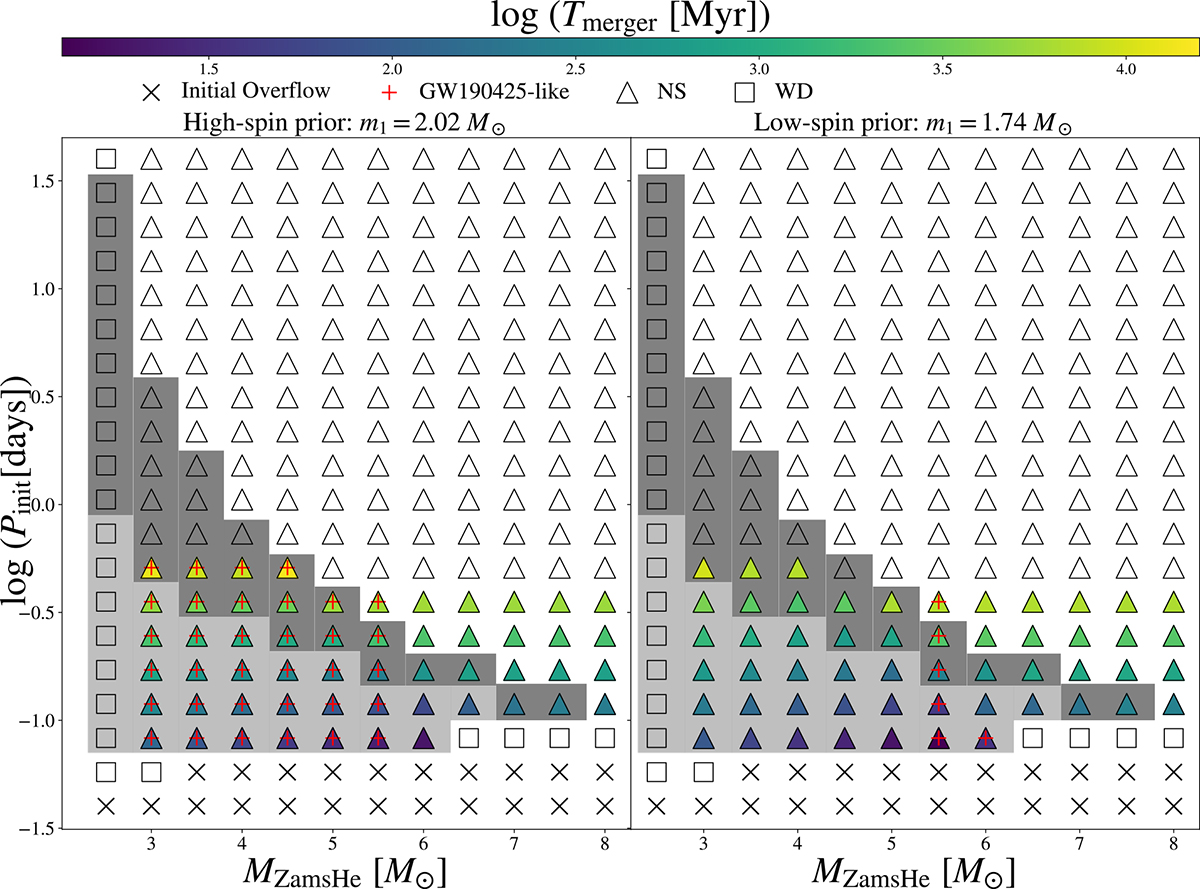
As in Figure 2, but the color bar refers to the merger time of BNS due to the emission of GWs. We use the red plus symbol to mark the systems that resemble GW190425-like events.
Current usage metrics show cumulative count of Article Views (full-text article views including HTML views, PDF and ePub downloads, according to the available data) and Abstracts Views on Vision4Press platform.
Data correspond to usage on the plateform after 2015. The current usage metrics is available 48-96 hours after online publication and is updated daily on week days.
Initial download of the metrics may take a while.