Fig. 3
Download original image
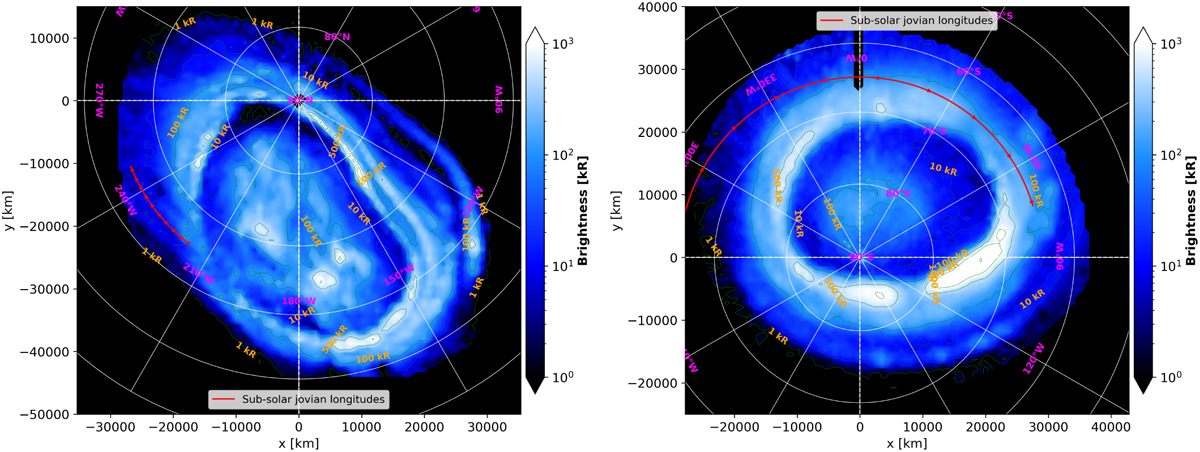
Integrated UV emissions in the [155 nm, 162 nm] range rescaled by a factor of 8.1 to obtain a map of the total unabsorbed emissions from Jupiter’s auroral regions observed during PJ11 in the SIII Jovicentric reference frame. The red arrowed lines represent the solar longitude progression during the observation. The iso-brightening contours have the following values: [1, 10, 100, 500, 1000, 2000] in kR.
Current usage metrics show cumulative count of Article Views (full-text article views including HTML views, PDF and ePub downloads, according to the available data) and Abstracts Views on Vision4Press platform.
Data correspond to usage on the plateform after 2015. The current usage metrics is available 48-96 hours after online publication and is updated daily on week days.
Initial download of the metrics may take a while.