Fig. 10
Download original image
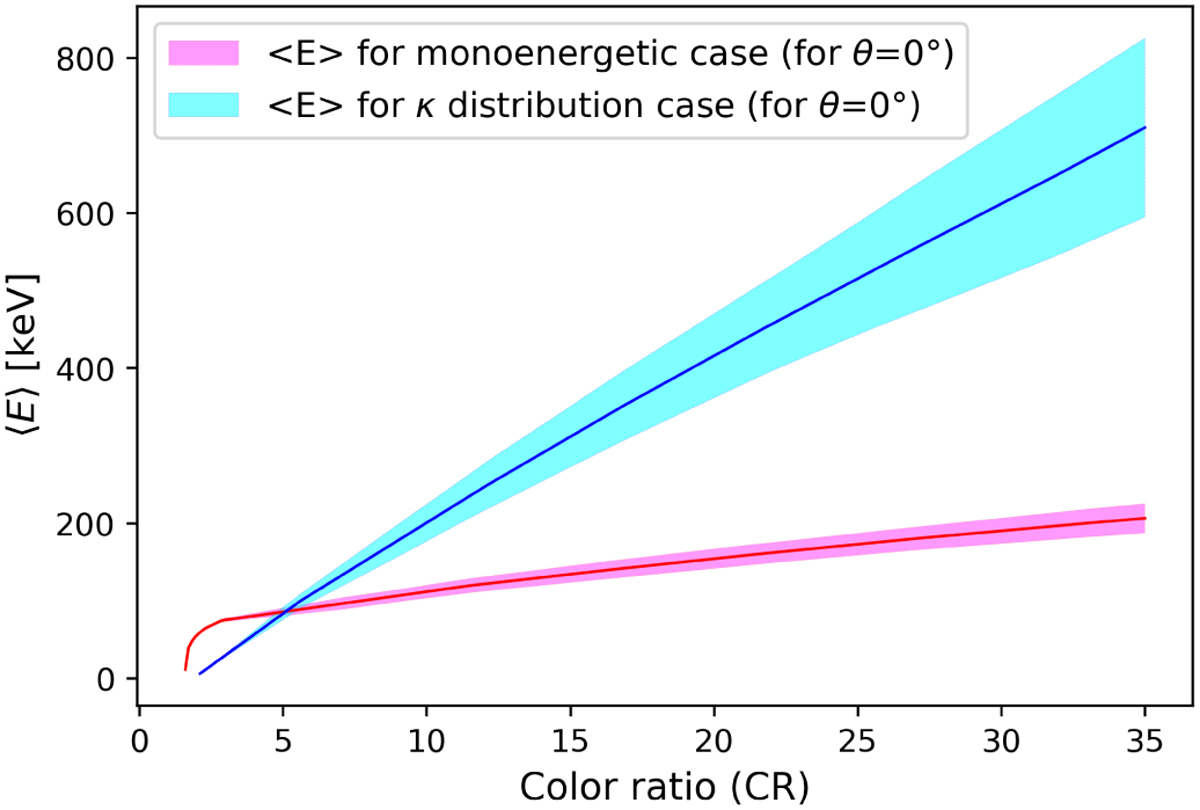
Evolution of the modeled ⟨E⟩ as a function of the CR. The cyan and magenta confidence bands represent the uncertainty on the inverted mean energy, taking the CH4 variability in the auroral regions into account, for the kappa and monoenergetic distribution cases, respectively. In this example, we illustrate the evolution of the uncertainty in the inverted mean energy as a function of the CR for an emission angle θ = 0°. For higher emission angles, the uncertainty follows a similar pattern.
Current usage metrics show cumulative count of Article Views (full-text article views including HTML views, PDF and ePub downloads, according to the available data) and Abstracts Views on Vision4Press platform.
Data correspond to usage on the plateform after 2015. The current usage metrics is available 48-96 hours after online publication and is updated daily on week days.
Initial download of the metrics may take a while.