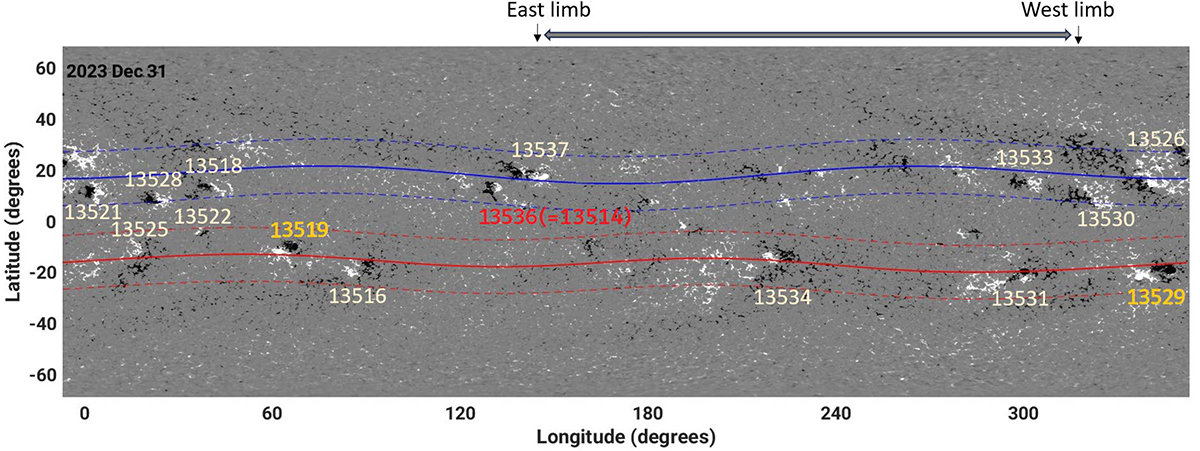
Fig. A.3.
Download original image
Same as in Fig A.1, but for the synoptic map on December 31, 2023. Note that December 7’s ARs 13513 and 13514 at 137-degree longitude in Fig. A.2 rotate to the back side and reappear to the front as AR 13537 and 13536 respectively at the same longitude on December 31. Here, ARs resulting in X-class flares are highlighted in red, while active regions resulting in M-class flares are highlighted in orange.
Current usage metrics show cumulative count of Article Views (full-text article views including HTML views, PDF and ePub downloads, according to the available data) and Abstracts Views on Vision4Press platform.
Data correspond to usage on the plateform after 2015. The current usage metrics is available 48-96 hours after online publication and is updated daily on week days.
Initial download of the metrics may take a while.