Open Access
Fig. A.1.
Download original image
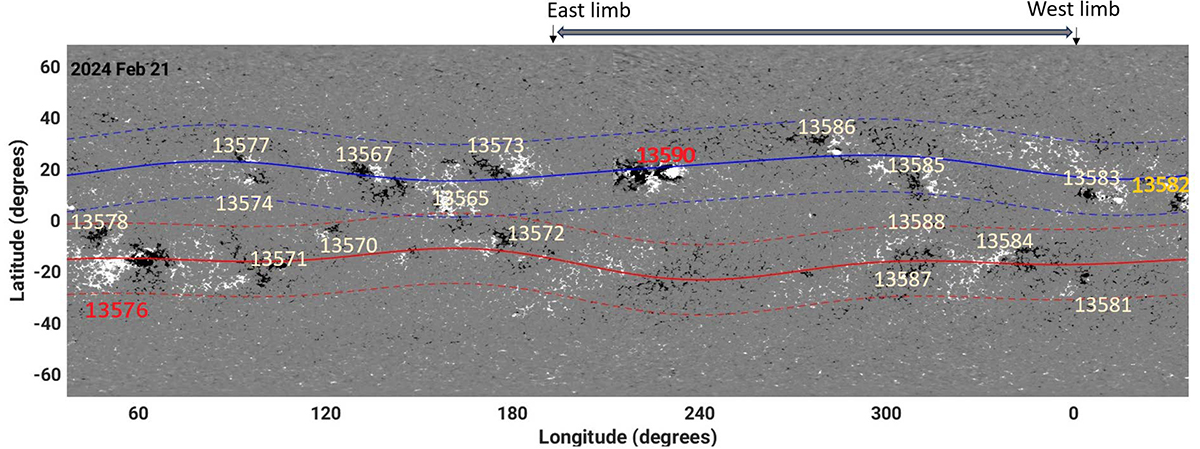
All ARs numbered by NOAA are spotted and marked on February 21, 2024, synoptic map constructed from SDO/HMI daily fits files. The double-arrowed topbar indicates which ARs are on the front side. Here, ARs resulting in X-class Flares are highlighted in red, while ARs resulting in M-class flares are highlighted in orange.
Current usage metrics show cumulative count of Article Views (full-text article views including HTML views, PDF and ePub downloads, according to the available data) and Abstracts Views on Vision4Press platform.
Data correspond to usage on the plateform after 2015. The current usage metrics is available 48-96 hours after online publication and is updated daily on week days.
Initial download of the metrics may take a while.