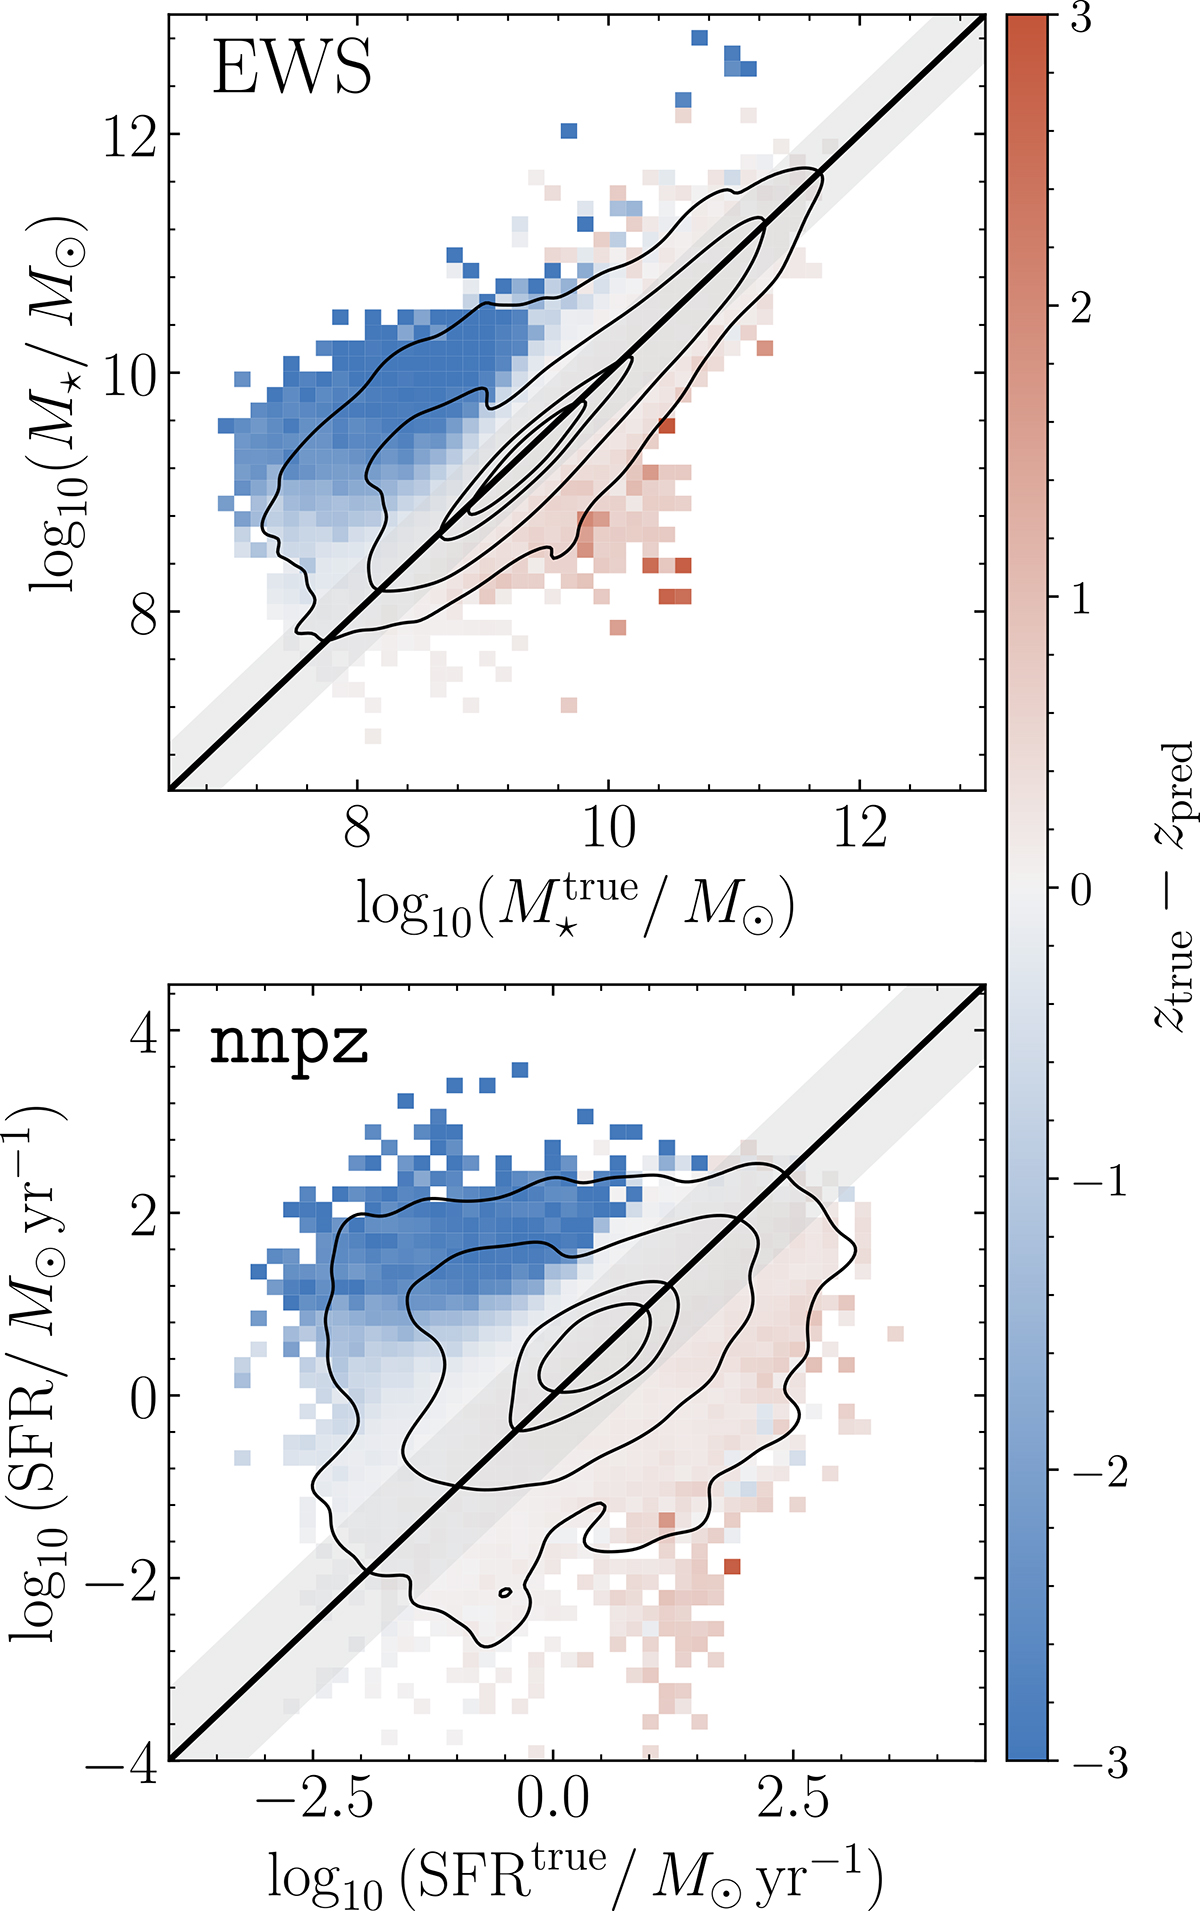
Fig. 9.
Download original image
Stellar masses (top panel) and SFRs (bottom panel), color coded with the difference between the true and predicted redshifts, for the nnpz results in the EWS trained with wide features (the upper-right plots in Figs. 6–7). Similar results are obtained for all the other methods considered. The black line is the 1:1 relation. Shaded area is the region beyond which a prediction is an outlier (0.4 dex for stellar masses, 0.8 dex for SFRs, see Sect. 3.6). Contours are the area containing 98%, 86%, 39% (corresponding to the 3σ, 2σ and 1σ levels for a 2D histogram) and 20% of the sample. The zpred − ztrue are measured as the median of the values falling in each true vs predicted bin. It is clearly visible how the wrong photo-z attribution generates the main bulk of catastrophic outliers. However, the distribution scatter along the 1:1 relation – i.e., the NMAD – is mainly due to the inherent difficulties of the methods in assigning the correct PPs given the set of input features independently from the inferred photo-z. This is particularly true for SFRs. This plot also illustrates how penalizing a 0.3 dex definition for catastrophic outliers would be with respect with the ones chosen for this work, which actually follows better the distribution of true and predicted PPs.
Current usage metrics show cumulative count of Article Views (full-text article views including HTML views, PDF and ePub downloads, according to the available data) and Abstracts Views on Vision4Press platform.
Data correspond to usage on the plateform after 2015. The current usage metrics is available 48-96 hours after online publication and is updated daily on week days.
Initial download of the metrics may take a while.