Fig. 5.
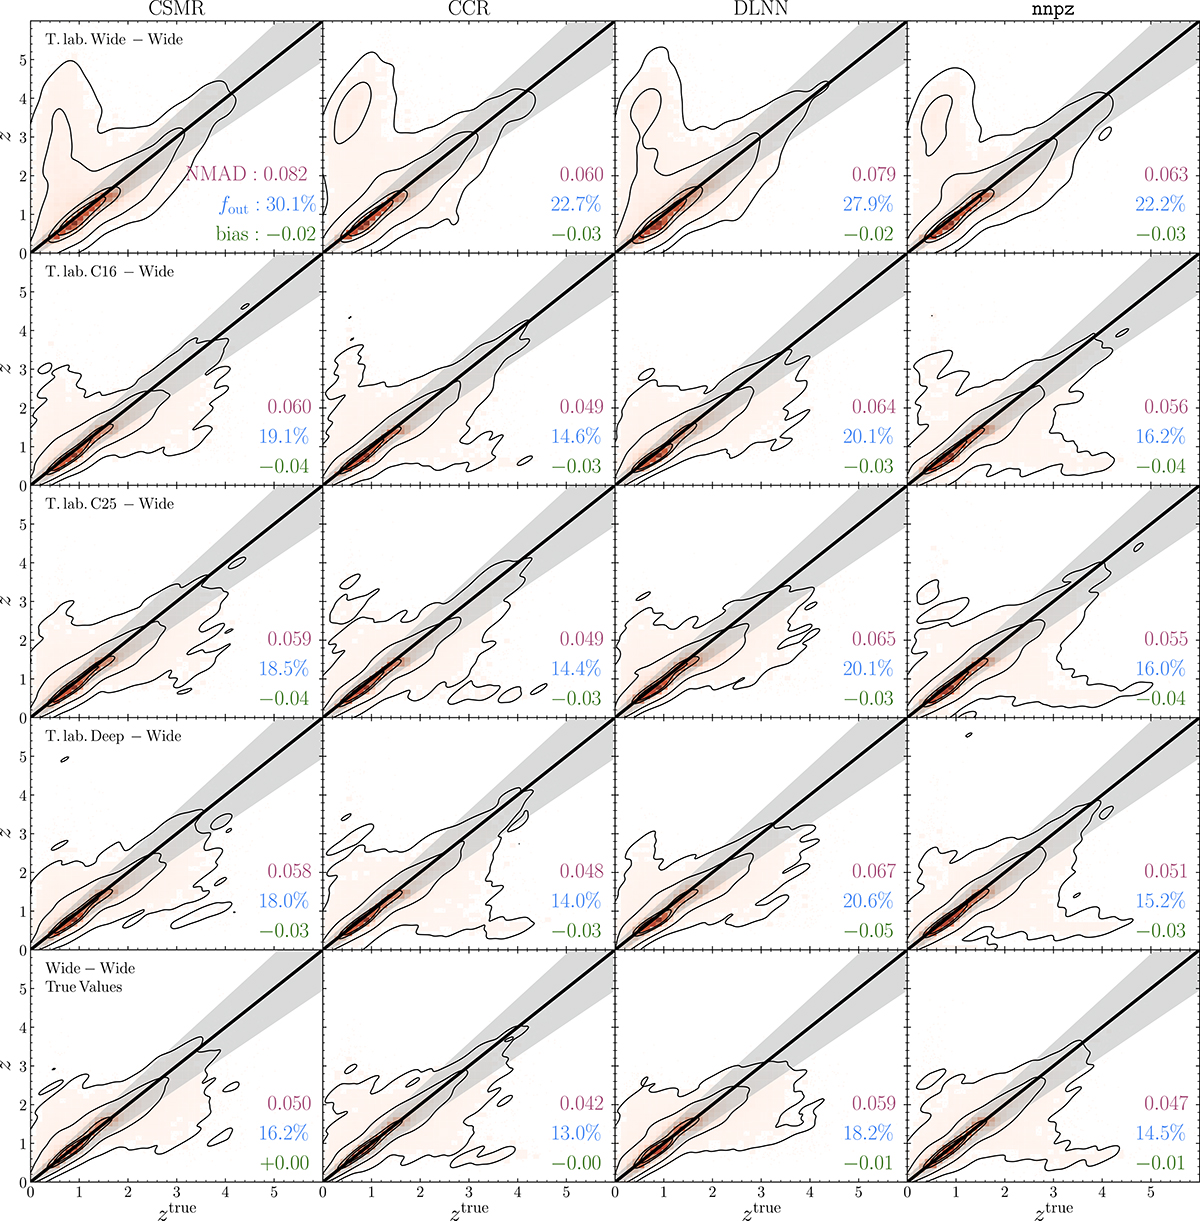
Download original image
Results for the EWS with the mixed labels approach. The true values on the x-axis are plotted against the predicted values on y. The black line is the 1:1 relation; the shaded area is the region beyond which a prediction is an outlier. Contours are the area containing 98%, 86%, 39% (corresponding to the 3σ, 2σ and 1σ levels for a 2D histogram) and 20% of the sample. Each column represents the results for the methods described in Sect. 3. In the first four rows, the training labels are the recovered ones, coming from Phosphoros results to the mock photometry at the same depth of the field reported in the leftmost plot legend and tested on the EWS (see Sect. 2 for further details). The T.lab Wide-Wide case is exactly the same as the Wide-Wide case in Table C.1. In the fifth row, we show the results of the EWS training the models with their true labels as the best-case scenario for that particular field. The reported metrics are NMAD (purple), the outlier fraction fout (blue) and the bias (green) for the photometric redshifts and physical parameters, as well as the slope m, scatter σ and fraction of passive galaxies fp for the SFMS, all defined in Sect. 3.6).
Current usage metrics show cumulative count of Article Views (full-text article views including HTML views, PDF and ePub downloads, according to the available data) and Abstracts Views on Vision4Press platform.
Data correspond to usage on the plateform after 2015. The current usage metrics is available 48-96 hours after online publication and is updated daily on week days.
Initial download of the metrics may take a while.