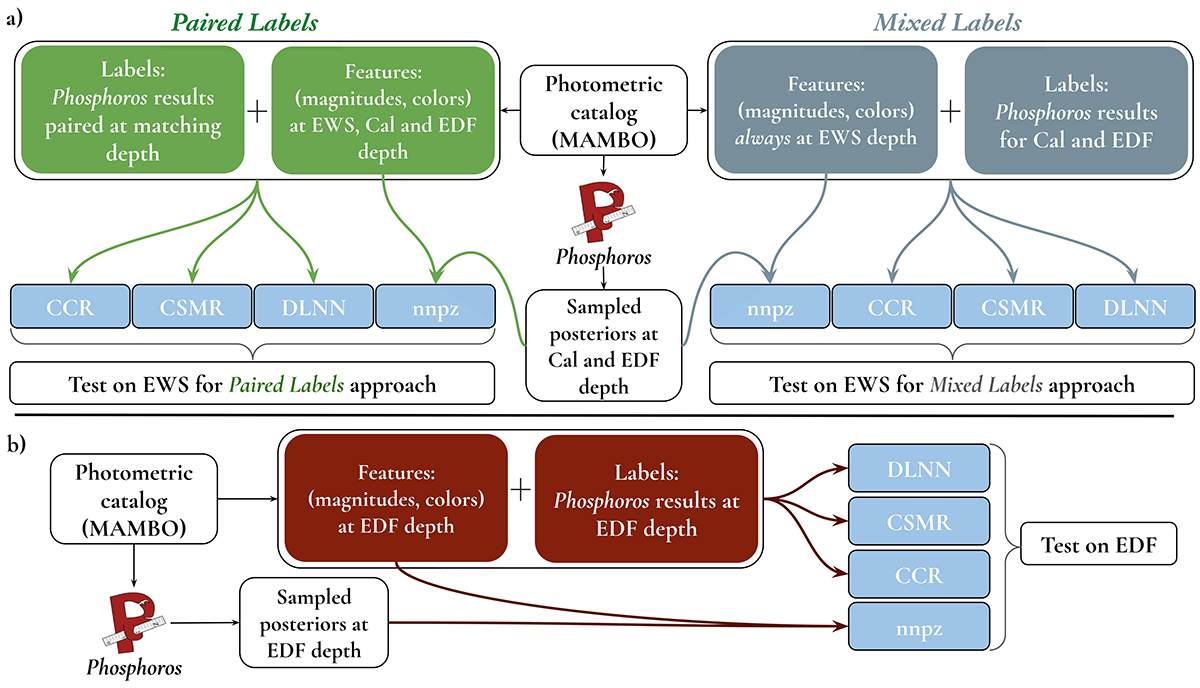
Fig. 4.
Download original image
Flowchart followed for the reported results on the EWS and EDF. Panel (a) summarizes what has been done for the EWS. In this case, we employed two different approaches: pairing features to labels coming from Phosphoros results at the corresponding depth (paired labels), or with features always from the Wide simulated catalog and labels coming from Phosphoros results at the Calibration and Deep fields depth for the corresponding sources (mixed labels). These pairs of (features, labels) – or (features, posteriors for nnpz (see Sect. 3.4) – are thus given as input for the ML models described in Sect. 3. Panel (b) illustrates the straighter flowchart for the EDF, where the pairs (features, labels) or (features, posteriors) always come from the simulated Deep field.
Current usage metrics show cumulative count of Article Views (full-text article views including HTML views, PDF and ePub downloads, according to the available data) and Abstracts Views on Vision4Press platform.
Data correspond to usage on the plateform after 2015. The current usage metrics is available 48-96 hours after online publication and is updated daily on week days.
Initial download of the metrics may take a while.