Fig. 10.
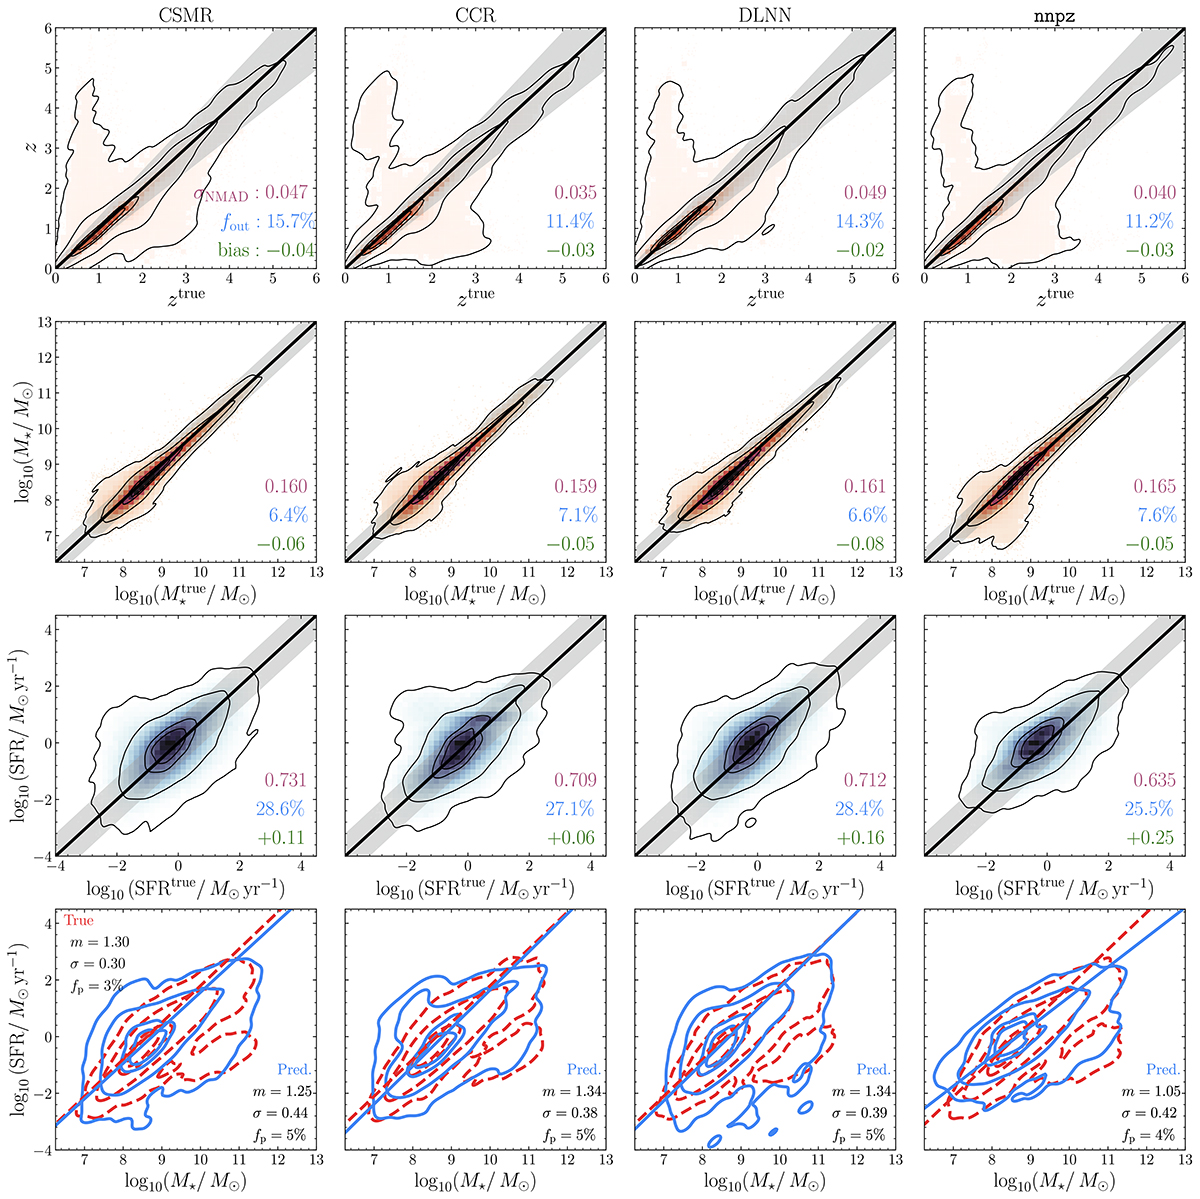
Download original image
Results for the EDF. Each column represents the results for the methods described in Sect. 3. The first three rows are the labels, with the true value plotted against the predicted one. The fourth column is the MSFS, with true values in red (dashed) and predicted ones in blue (solid). The reported metrics are the NMAD (purple), outlier fraction fout (blue), the bias (green), and for the SFMS the slope (α), the scatter (σ) and fraction of passive galaxies (fp), all defined in Sect. 3.6.
Current usage metrics show cumulative count of Article Views (full-text article views including HTML views, PDF and ePub downloads, according to the available data) and Abstracts Views on Vision4Press platform.
Data correspond to usage on the plateform after 2015. The current usage metrics is available 48-96 hours after online publication and is updated daily on week days.
Initial download of the metrics may take a while.