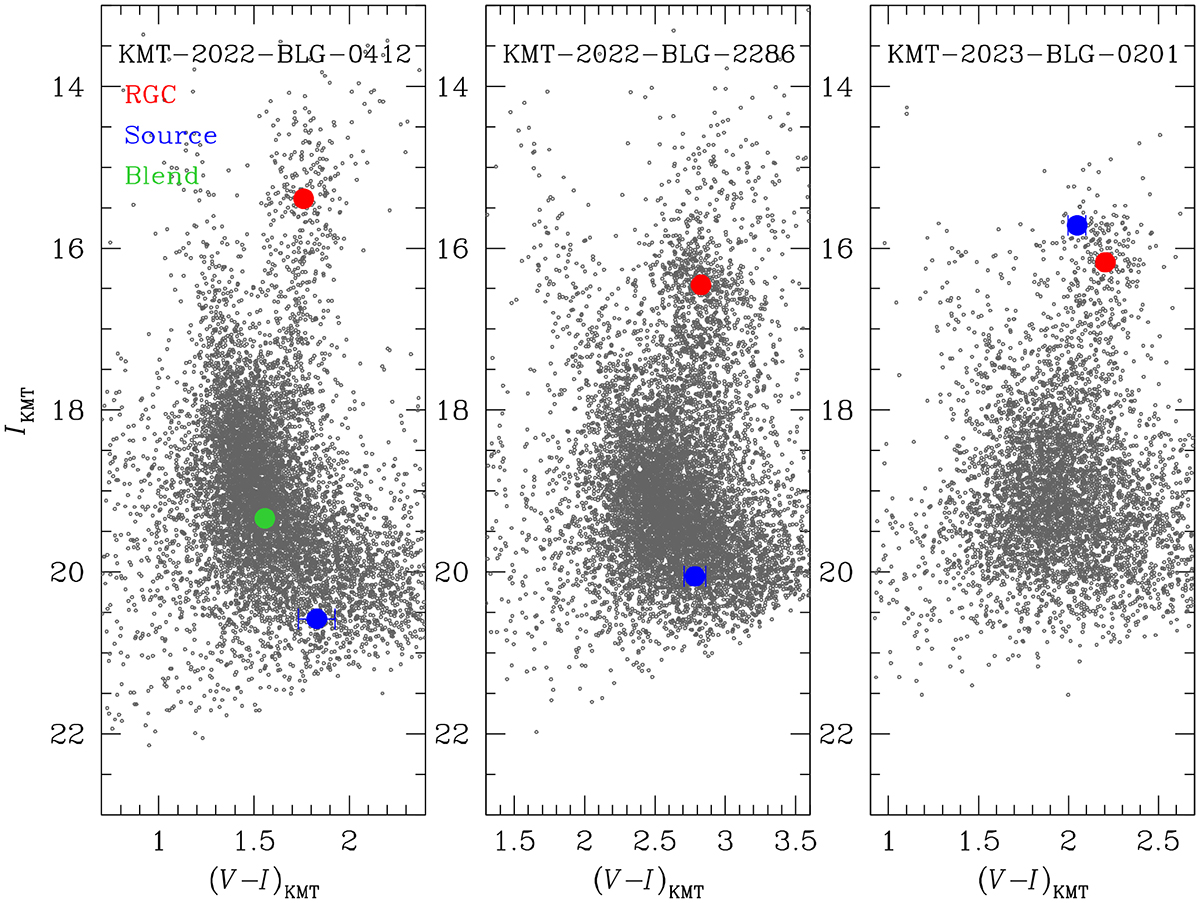
Fig. 13.
Download original image
Color-magnitude diagrams of source stars for the lensing event KMT-2022-BLG-0412, KMT-2022-BLG-2286, and KMT-2023-BLG-0201. In each panel, small filled dots marked in red and blue represent the positions of red giant clump (RGC) centroid and source, respectively. For the event KMT-2022-BLG-0412, we additionally mark the position of the blend.
Current usage metrics show cumulative count of Article Views (full-text article views including HTML views, PDF and ePub downloads, according to the available data) and Abstracts Views on Vision4Press platform.
Data correspond to usage on the plateform after 2015. The current usage metrics is available 48-96 hours after online publication and is updated daily on week days.
Initial download of the metrics may take a while.