Fig. 5.
Download original image
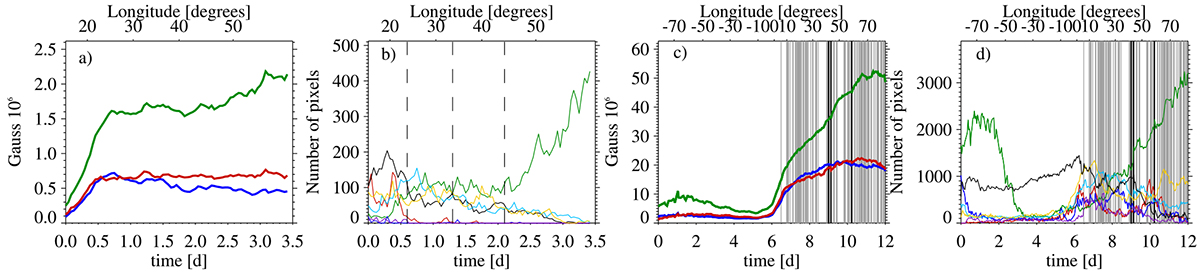
(a–b) Magnetic flux evolution and color curves for active region NOAA 12118. The vertical dashed lines mark the transitions between different evolutionary stages (see text). (c–d) Magnetic flux evolution and color curves for active region NOAA 12673. Vertical lines indicate flares and thick vertical lines indicate X-class flares. The time is in decimal days measured from the beginning of their observation, that is, at 17 July 2014 16:34 UT for NOAA 12118 and at 28 August 2017 08:58 UT for NOAA 12673.
Current usage metrics show cumulative count of Article Views (full-text article views including HTML views, PDF and ePub downloads, according to the available data) and Abstracts Views on Vision4Press platform.
Data correspond to usage on the plateform after 2015. The current usage metrics is available 48-96 hours after online publication and is updated daily on week days.
Initial download of the metrics may take a while.