Fig. 4.
Download original image
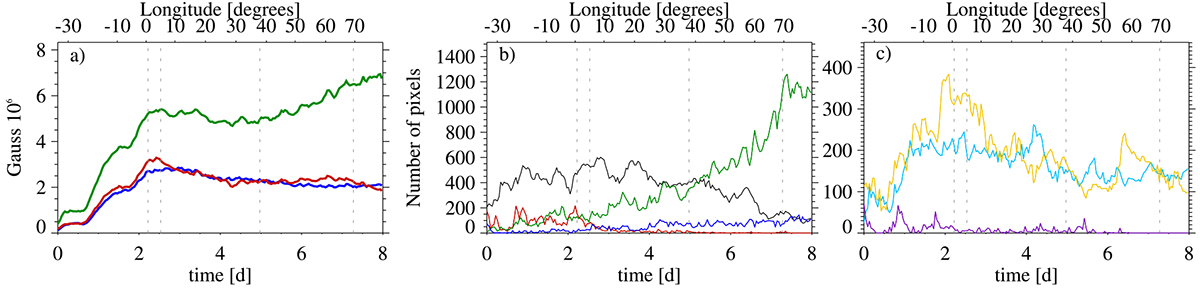
Comparative overview of the evolution of the magnetic flux components and the color curves for active region NOAA 11072. (a) Total unsigned Bz (green), Bx (red), and By (blue), (b) total number of pixels with red, green, blue, and white color (red, green, blue, and black, respectively), and (c) total number of pixels with cyan, magenta, and yellow color. The vertical dashed lines indicate the times of B-class flares.
Current usage metrics show cumulative count of Article Views (full-text article views including HTML views, PDF and ePub downloads, according to the available data) and Abstracts Views on Vision4Press platform.
Data correspond to usage on the plateform after 2015. The current usage metrics is available 48-96 hours after online publication and is updated daily on week days.
Initial download of the metrics may take a while.