Fig. 1.
Download original image
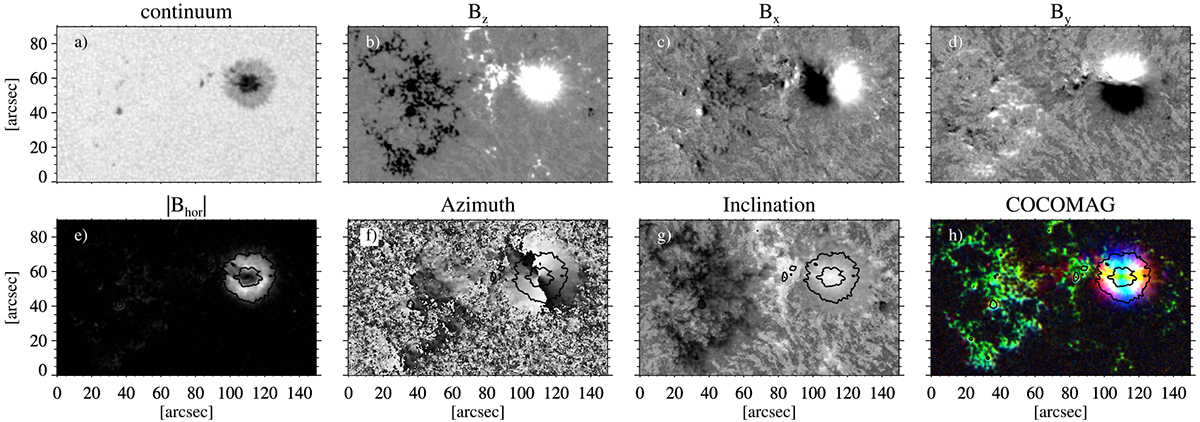
Active region NOAA 11072. The upper row shows information contained in the SHARPS CEA data, namely (a) the maps of the continuum intensity, provided here for context, (b) the vertical component, Bz, and (c and d) the horizontal Bx and By components of the photospheric magnetic field. The magnetic field values were scaled to ±500 G for the vertical component and ±400 G for the horizontal ones. The lower row contains (e) the measure of the horizontal field Bhor, (f) the azimuth ranging from −180° to 180°, (g) the inclination ranging between −90° and 90°, and (h) the COCOMAG produced by Bx, By, and Bz. Contours of the continuum intensity were added to mark the boundaries of the umbra and the penumbra of the spot for context.
Current usage metrics show cumulative count of Article Views (full-text article views including HTML views, PDF and ePub downloads, according to the available data) and Abstracts Views on Vision4Press platform.
Data correspond to usage on the plateform after 2015. The current usage metrics is available 48-96 hours after online publication and is updated daily on week days.
Initial download of the metrics may take a while.