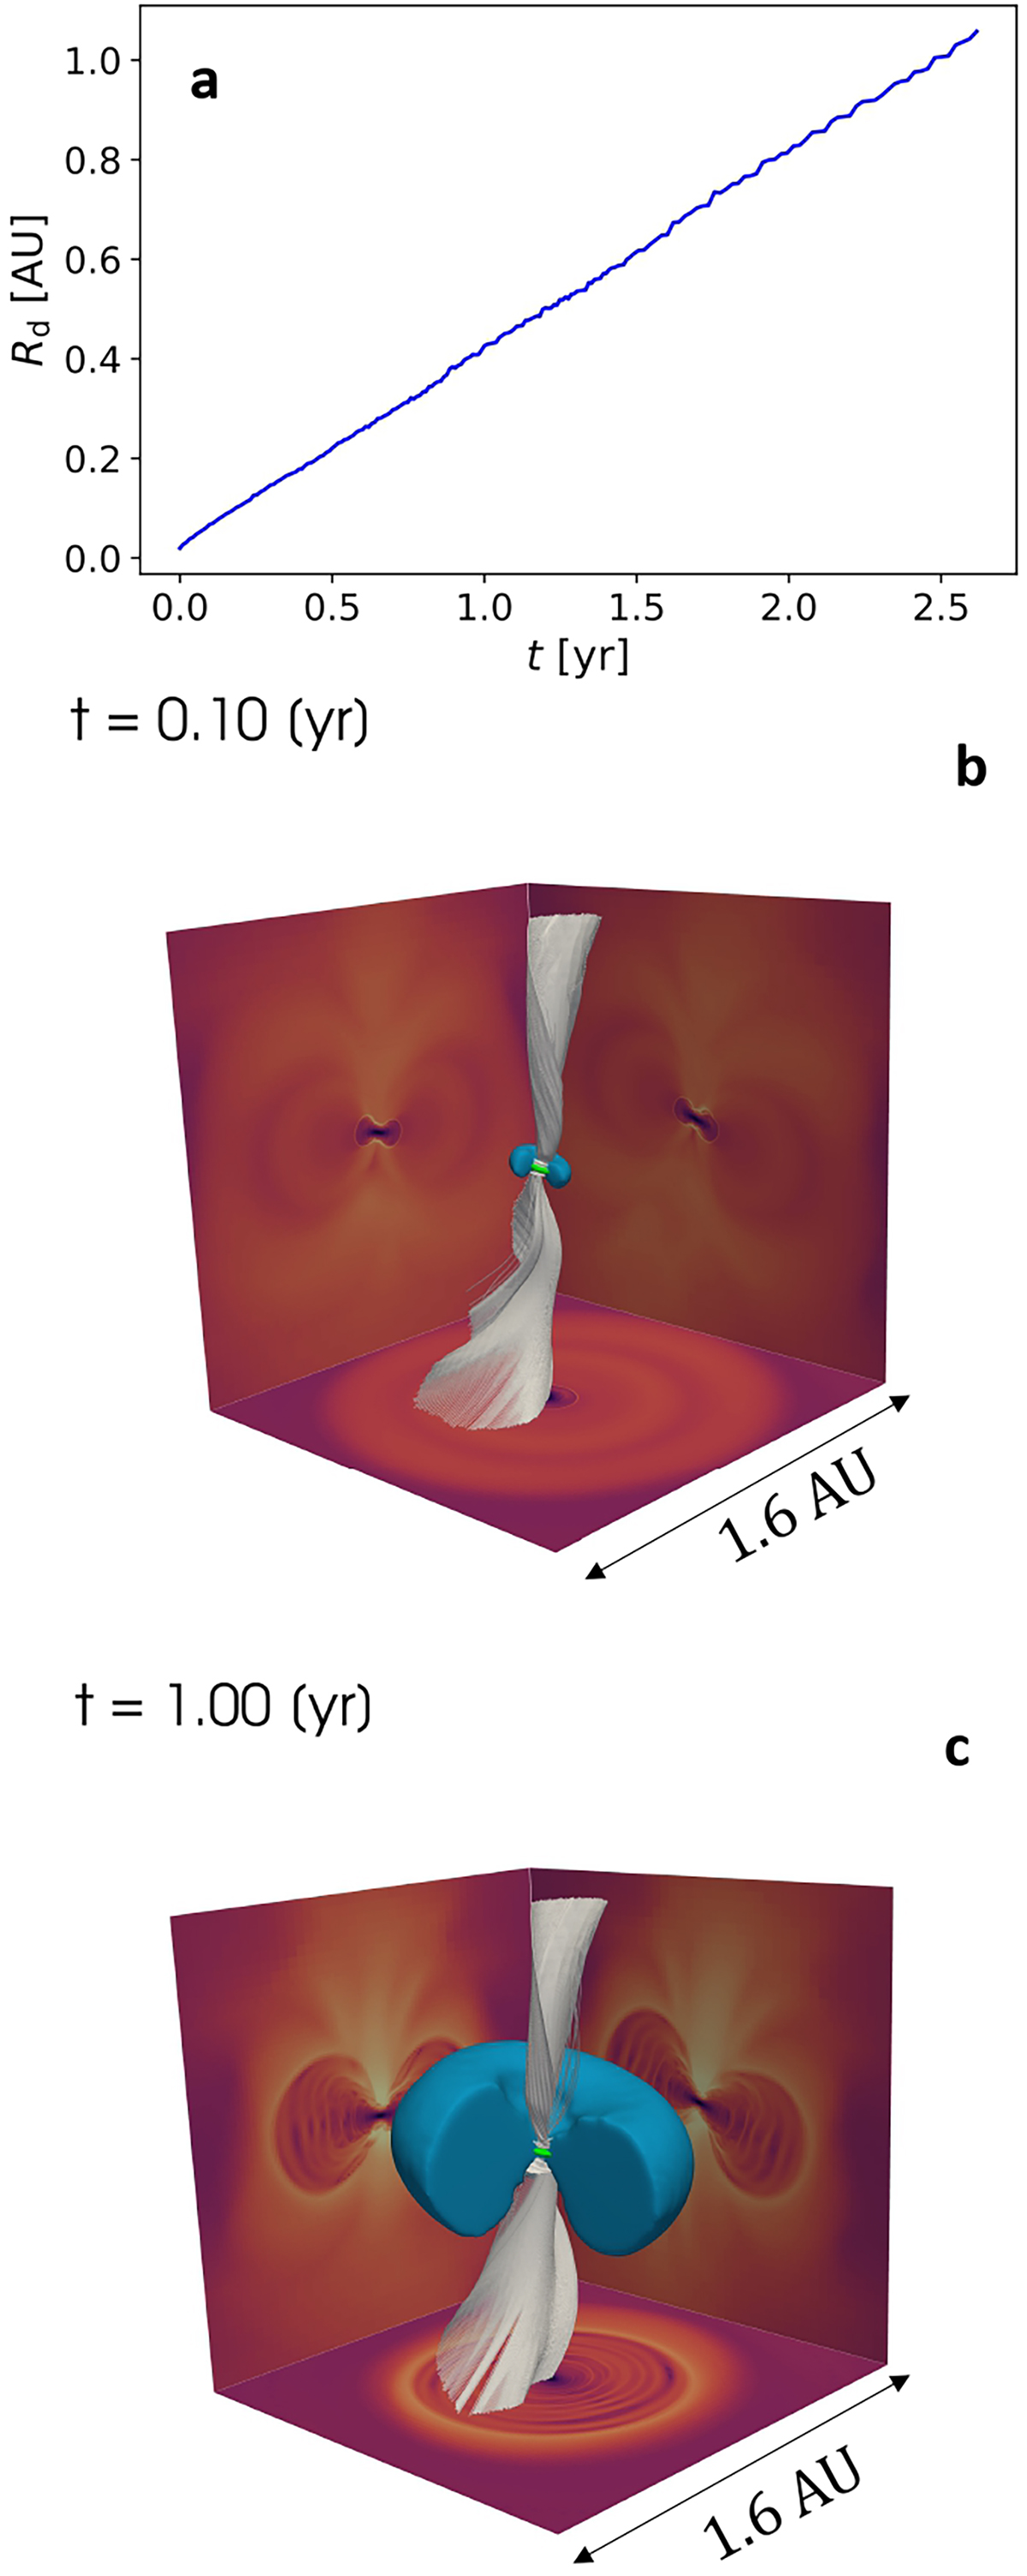
Fig. 7.
Download original image
Illustration of the rapid expansion of the inner circumstellar disk. Panel (a) displays the disk radius as a function of time, where t = 0 corresponds to the moment of birth of the disk. Panels (b) and (c) are 3D renderings at t = 0.1 yr and t = 1 yr, respectively, where the blue surface is the circumstellar disk and the green surface is the protostar. The white curves are velocity vector field streamlines, illustrating polar accretion. The images are cross-sectional slices displaying the radiative flux, which illustrates the location of accretion shocks. Note: no outer disk forms in this simulation. This figure is adapted from Ahmad et al. (2024).
Current usage metrics show cumulative count of Article Views (full-text article views including HTML views, PDF and ePub downloads, according to the available data) and Abstracts Views on Vision4Press platform.
Data correspond to usage on the plateform after 2015. The current usage metrics is available 48-96 hours after online publication and is updated daily on week days.
Initial download of the metrics may take a while.