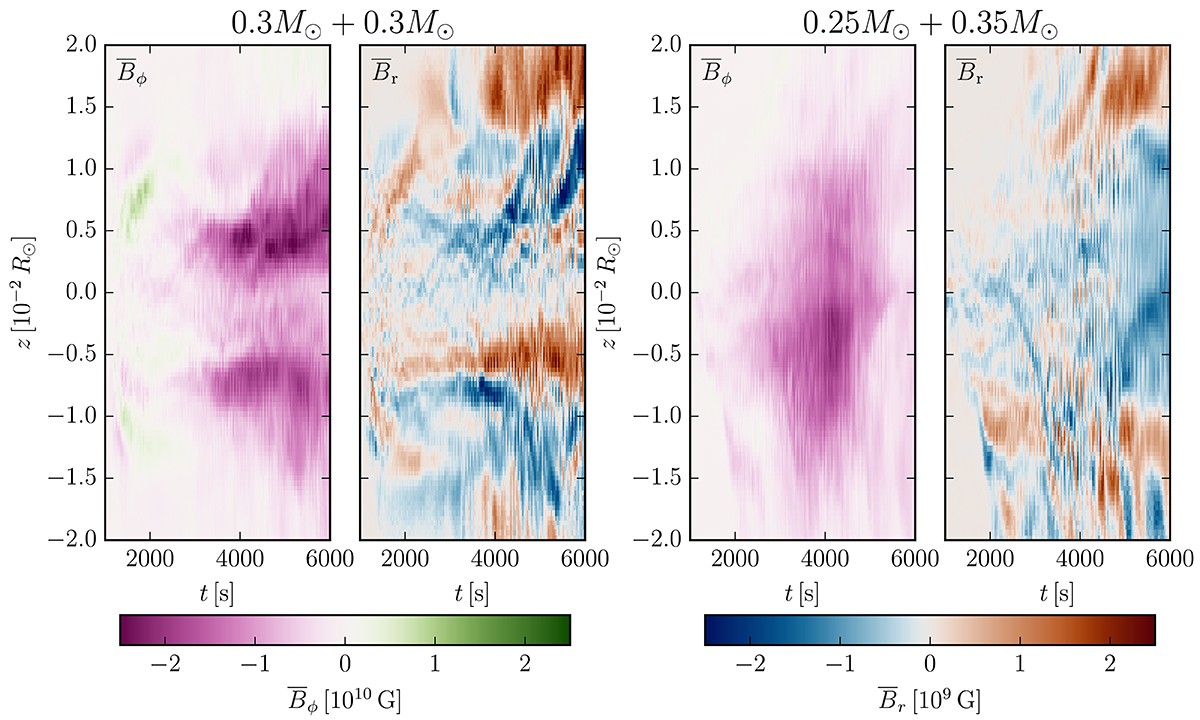
Fig. 6.
Download original image
Butterfly diagram at a cylindrical radius of 0.015 R⊙. The left two panels of the plot show the equal-mass merger, the right two panels the unequal-mass merger. The panels show the time evolution of the mean azimuthal (first and third panel) and radial (second and fourth panel) magnetic field versus height. The radial magnetic field shows the outward moving patterns that are characteristic for the MRI. The azimuthal field becomes a large-scale ordered, anti-aligned field.
Current usage metrics show cumulative count of Article Views (full-text article views including HTML views, PDF and ePub downloads, according to the available data) and Abstracts Views on Vision4Press platform.
Data correspond to usage on the plateform after 2015. The current usage metrics is available 48-96 hours after online publication and is updated daily on week days.
Initial download of the metrics may take a while.