Fig. 8
Download original image
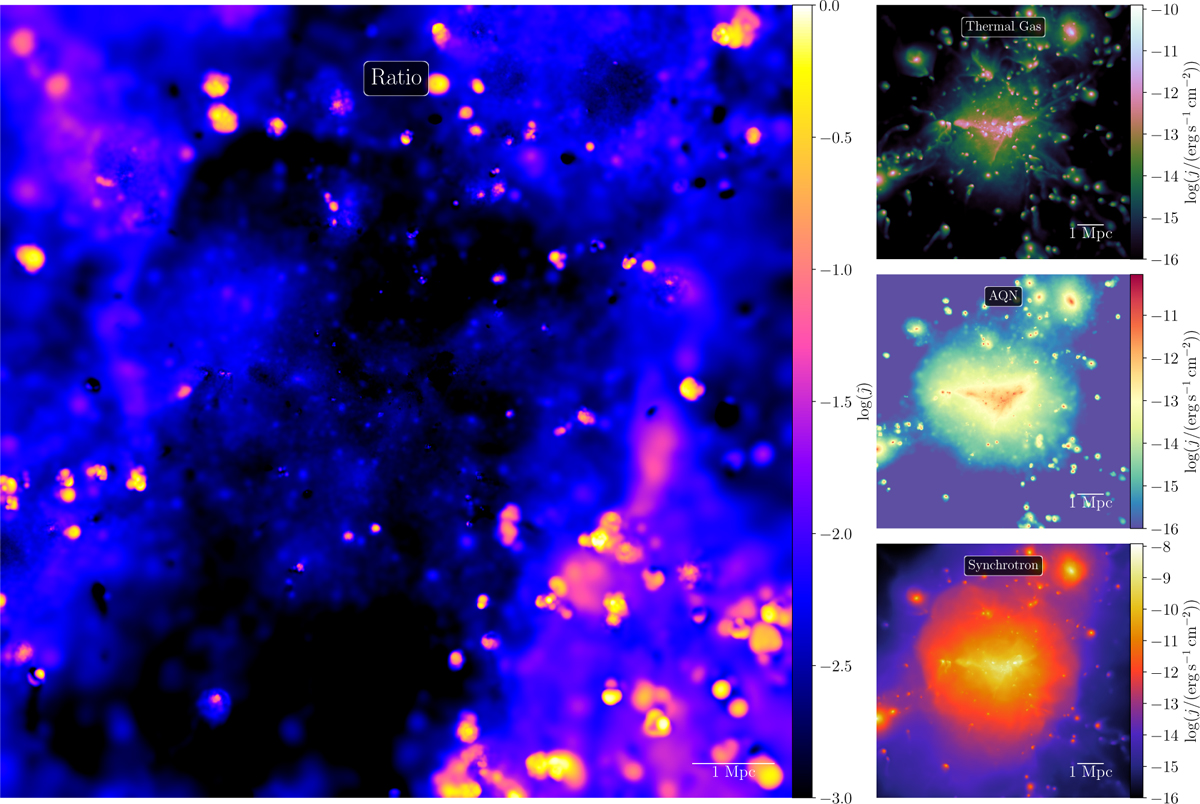
Ratio map expressed in ![]() , shown in the left column. The thermal gas, AQN, and synchrotron emission of Coma integrated over 1.40 GHz to 4.85 GHz, projected 3 rvir along the line of sight are given in the right column (from top to bottom). In this frequency window, the synchrotron emission of Coma is well constrained through radio emission (Thierbach et al. 2003). Due to the strong radio emission of Coma, here the contribution to the diffuse emission by AQNs is in the sub-percent level.
, shown in the left column. The thermal gas, AQN, and synchrotron emission of Coma integrated over 1.40 GHz to 4.85 GHz, projected 3 rvir along the line of sight are given in the right column (from top to bottom). In this frequency window, the synchrotron emission of Coma is well constrained through radio emission (Thierbach et al. 2003). Due to the strong radio emission of Coma, here the contribution to the diffuse emission by AQNs is in the sub-percent level.
Current usage metrics show cumulative count of Article Views (full-text article views including HTML views, PDF and ePub downloads, according to the available data) and Abstracts Views on Vision4Press platform.
Data correspond to usage on the plateform after 2015. The current usage metrics is available 48-96 hours after online publication and is updated daily on week days.
Initial download of the metrics may take a while.