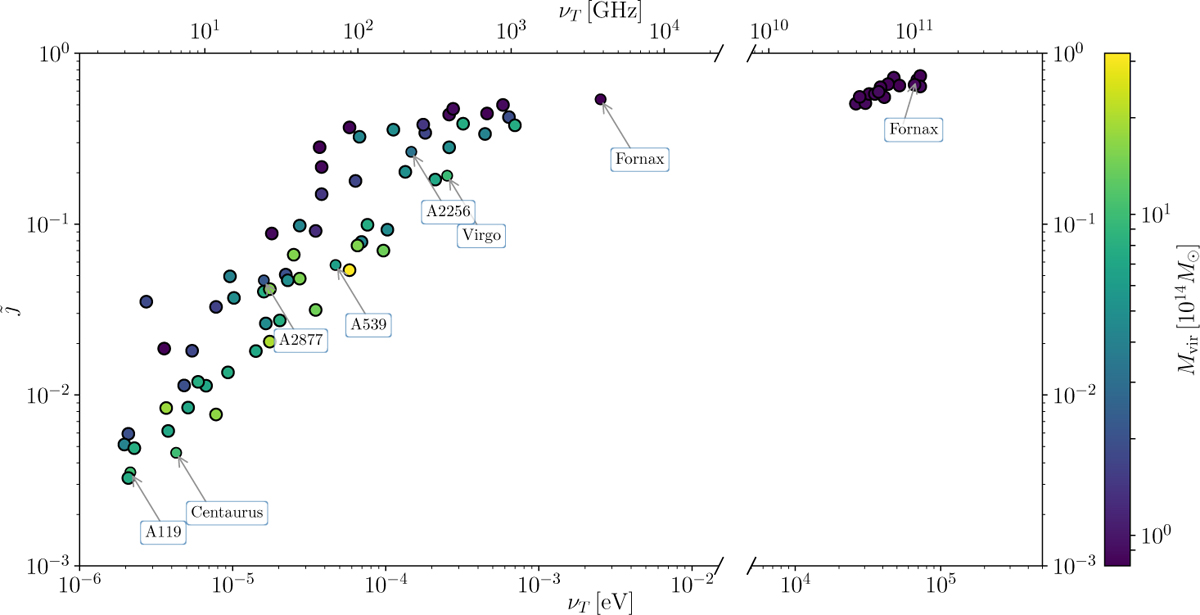
Fig. 7
Download original image
Transition frequency-integrated ratio-relation, color-coded by Mvir with frequency ranges of positive AQN contributions. The low-energy frequency range shows in which the thermal AQN emission dominates. Low cluster masses tend to reside on a tangent, slightly offset towards higher values. The high-energy frequency range shows in which the nonthermal AQN emission dominates. Only AQN emission, originating from the lowest Mvir shows an excess over the thermal gas emission in the high-energy regime. We removed one cluster from the plot where for numerical reasons we could not compute νT and the associated ![]() reliably.
reliably.
Current usage metrics show cumulative count of Article Views (full-text article views including HTML views, PDF and ePub downloads, according to the available data) and Abstracts Views on Vision4Press platform.
Data correspond to usage on the plateform after 2015. The current usage metrics is available 48-96 hours after online publication and is updated daily on week days.
Initial download of the metrics may take a while.