Open Access
Fig. 6
Download original image
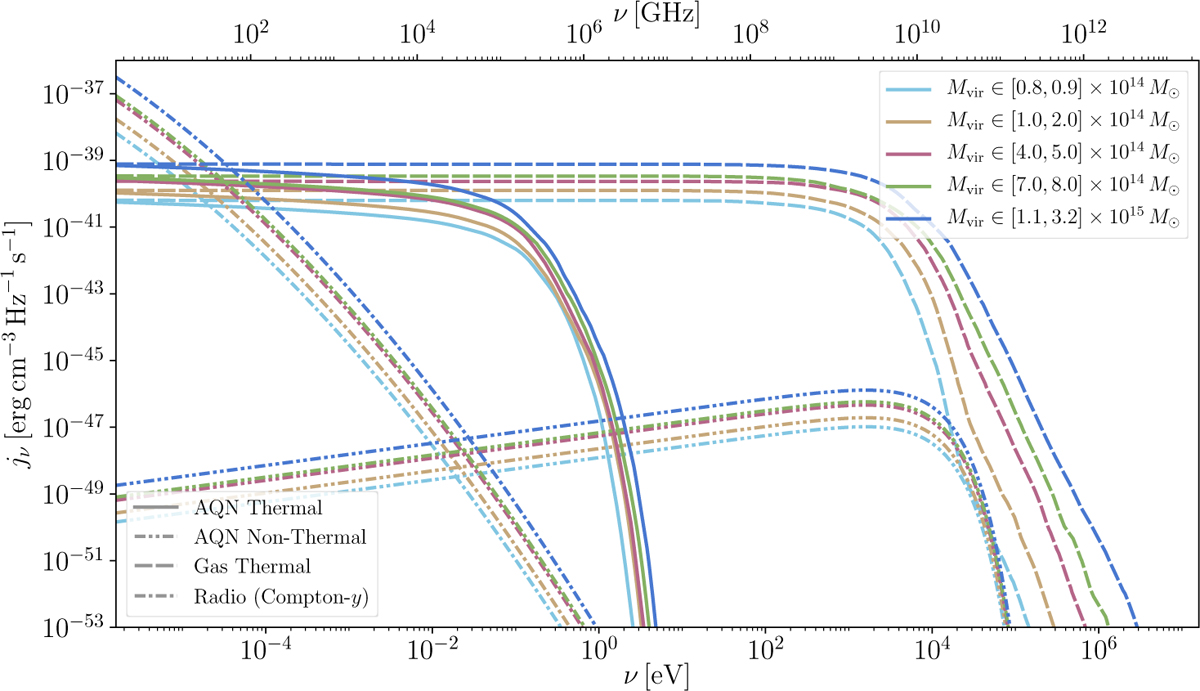
Median cluster spectra with lines for each mass bin out of sample 𝒜 over a frequency range of ν ∈ [10−5,108]/(2π)eV. The solid, dash-dot-dotted, dashed, and dash-dotted lines represent AQN thermal emission, non-thermal emission, ICM Bremsstrahlung, and synchrotron emission, respectively.
Current usage metrics show cumulative count of Article Views (full-text article views including HTML views, PDF and ePub downloads, according to the available data) and Abstracts Views on Vision4Press platform.
Data correspond to usage on the plateform after 2015. The current usage metrics is available 48-96 hours after online publication and is updated daily on week days.
Initial download of the metrics may take a while.