Fig. 5.
Download original image
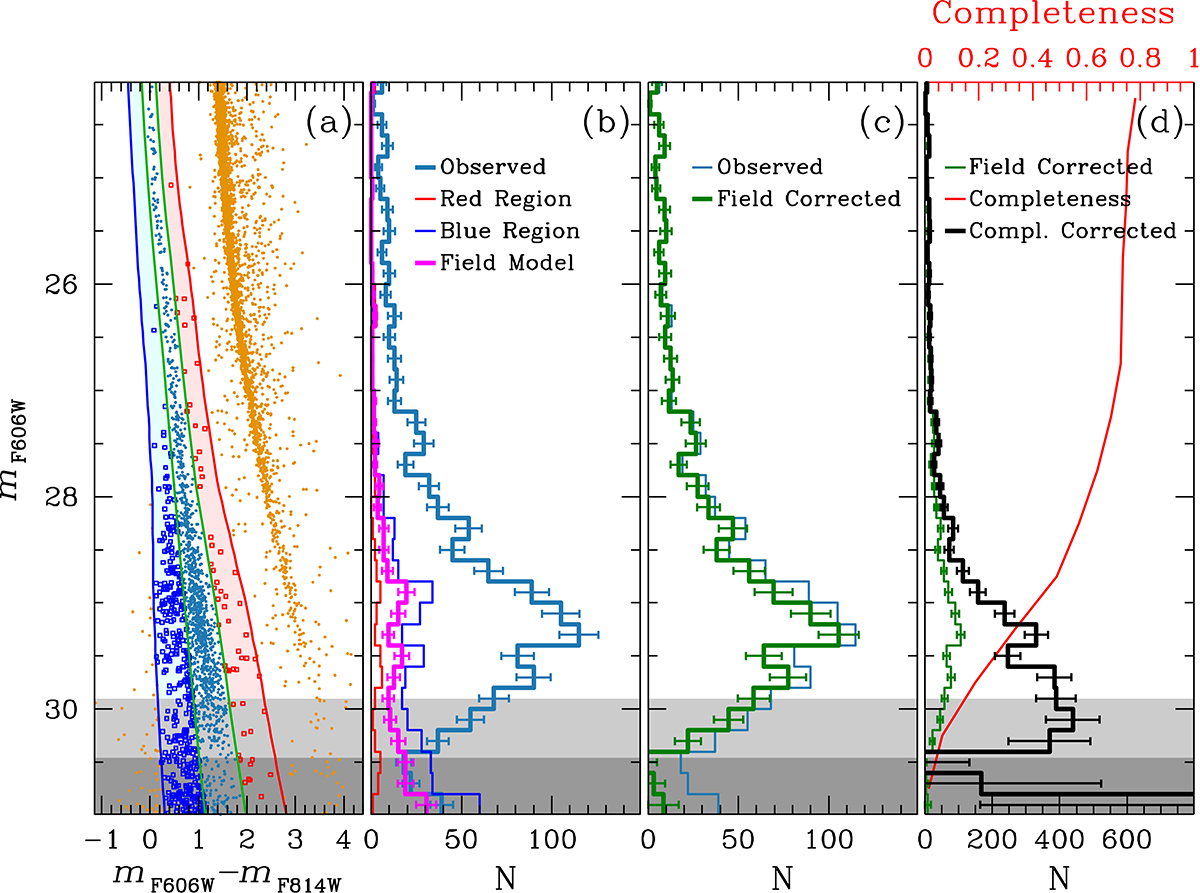
(a) CMD partitioned into three regions along the WD CS. The azure-shaded region indicates sources that pass the selection on the blue side of the WDs, while the red-shaded region represents those on the redder side. (b) WD CS LF, displaying histograms depicting the number of sources per magnitude interval for observed stars within the WD region and for stars in the two shaded regions. The magenta histogram represents our model for field distribution. (c) WD CS LF derived by subtracting the field model from the observed WD CS LF. (d) Observed field-corrected WD CS LF, adjusted for completeness, depicted in black. Grey-shaded areas indicate the 5- and 3-σ levels, where below 3-σ findings and completeness become unreliable. Errors were linearly propagated and then corrected for completeness.
Current usage metrics show cumulative count of Article Views (full-text article views including HTML views, PDF and ePub downloads, according to the available data) and Abstracts Views on Vision4Press platform.
Data correspond to usage on the plateform after 2015. The current usage metrics is available 48-96 hours after online publication and is updated daily on week days.
Initial download of the metrics may take a while.