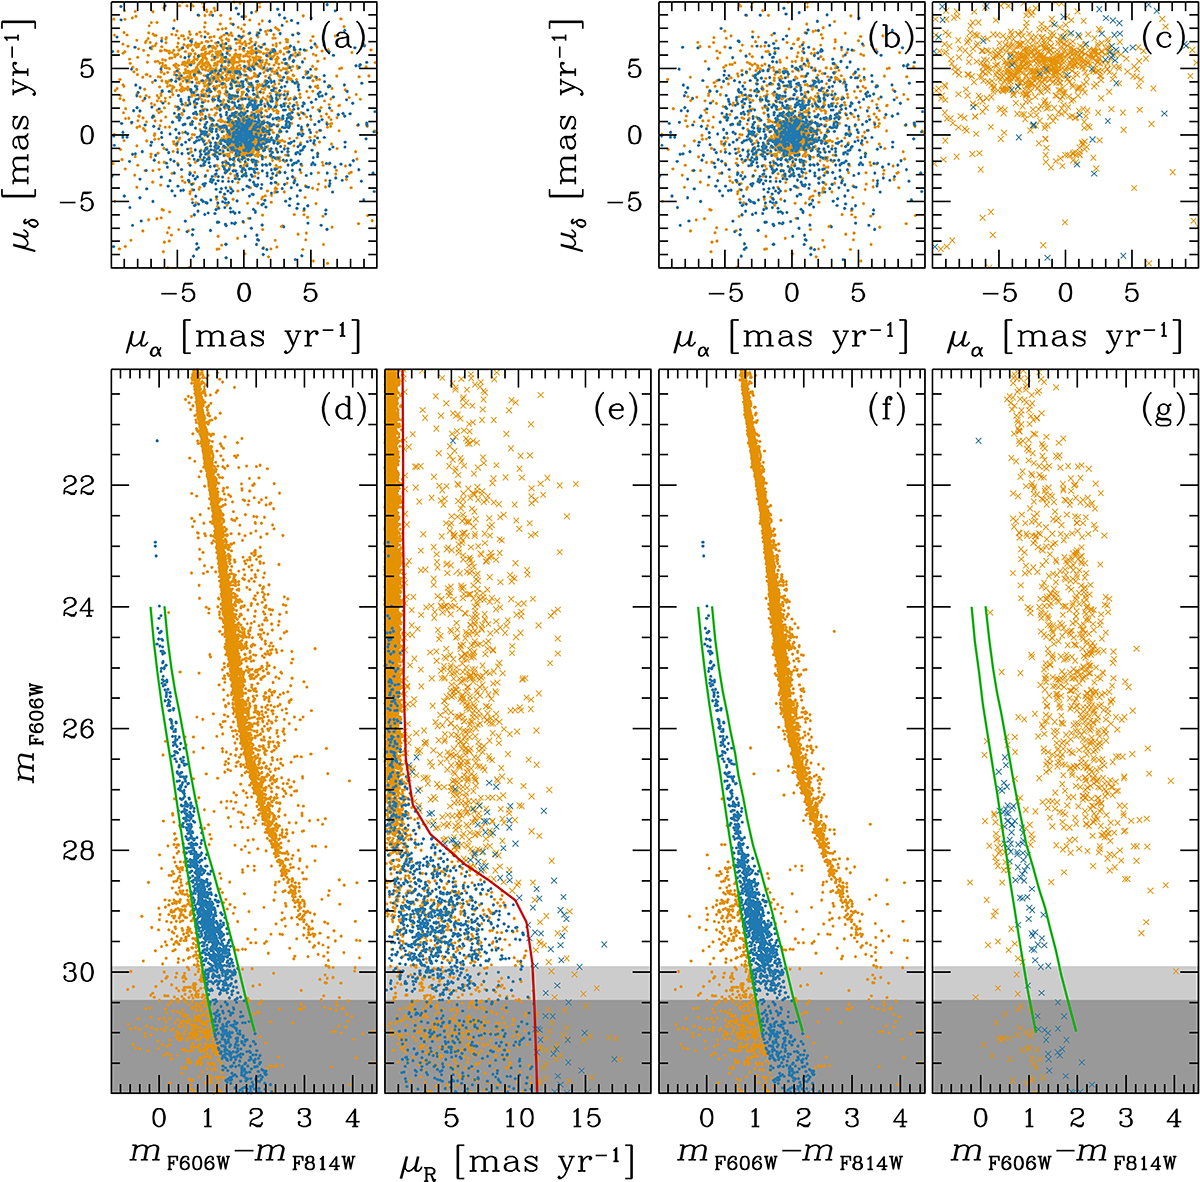
Fig. 4.
Download original image
(a)–(b)–(c) Vector point diagrams for the samples shown in the corresponding panels below. (d) CMD of the sources in panel (s1) of Fig. 3. In all panels, sources within the WD region (between the two green lines) are represented in blue, while all other sources are shown in orange. The light grey and dark grey shaded areas indicate the 5σ and 3σ limit, respectively, of significant detection for the sources of interest. (e) One-dimensional PM, μR, as a function of the mF606W magnitude. Bright stars (down to mF606W ∼ 28) exhibit a μR distribution with a tight dispersion (< 1.5 mas yr−1), along with a tail displaying a much broader dispersion. We arbitrarily define two regions, indicated by the red line: one enclosing the bulk of the μR values at different magnitudes (indicated by filled circles), and the other containing objects with larger μR (indicated by crosses). (f)–(g) CMDs for the stars within and beyond the red line defined in panel (e). Neither of the two CMDs solely consists of members or field objects (see text for details).
Current usage metrics show cumulative count of Article Views (full-text article views including HTML views, PDF and ePub downloads, according to the available data) and Abstracts Views on Vision4Press platform.
Data correspond to usage on the plateform after 2015. The current usage metrics is available 48-96 hours after online publication and is updated daily on week days.
Initial download of the metrics may take a while.