Fig. 8.
Download original image
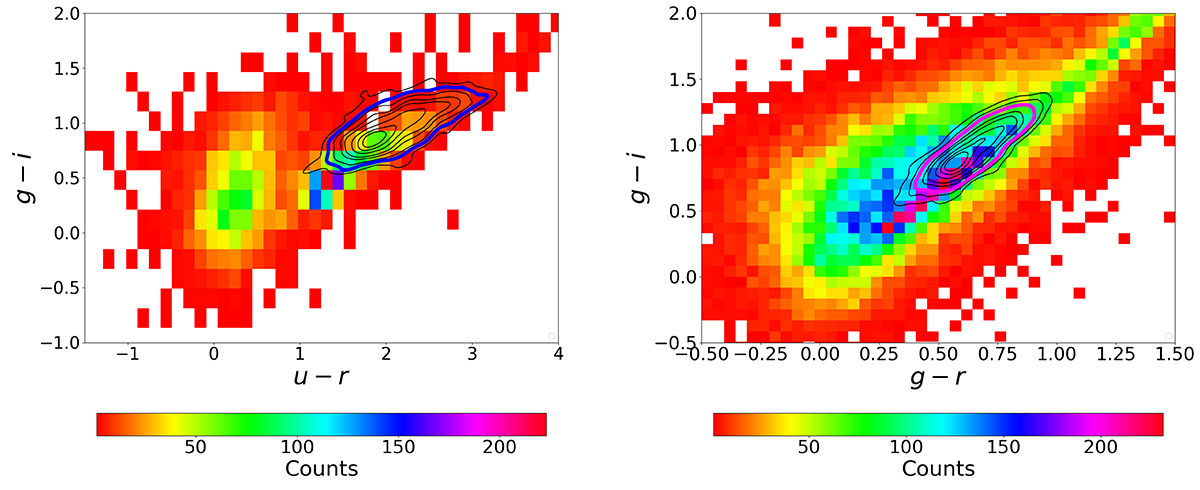
Color-color Hess diagrams of the preselected GC candidates in the ugri (left panel) and gri (right) catalogs. Solid black lines are the isodensity contours of GCs from the master catalog used in Cantiello et al. (2020). Each isodensity contour contains a certain percentage of GCs from the master catalog. In particular, going from the outer contour (lower GCs density) to the inner one (higher GCs density) the contours contain: 90%, 85%, 80%, 70%, 60%, 30%, 20%, and 10% of GCs in the master catalog. The 85% (80%) isodensity contour used for the selection are highlighted in blue (left) and magenta (right).
Current usage metrics show cumulative count of Article Views (full-text article views including HTML views, PDF and ePub downloads, according to the available data) and Abstracts Views on Vision4Press platform.
Data correspond to usage on the plateform after 2015. The current usage metrics is available 48-96 hours after online publication and is updated daily on week days.
Initial download of the metrics may take a while.