Fig. 5.
Download original image
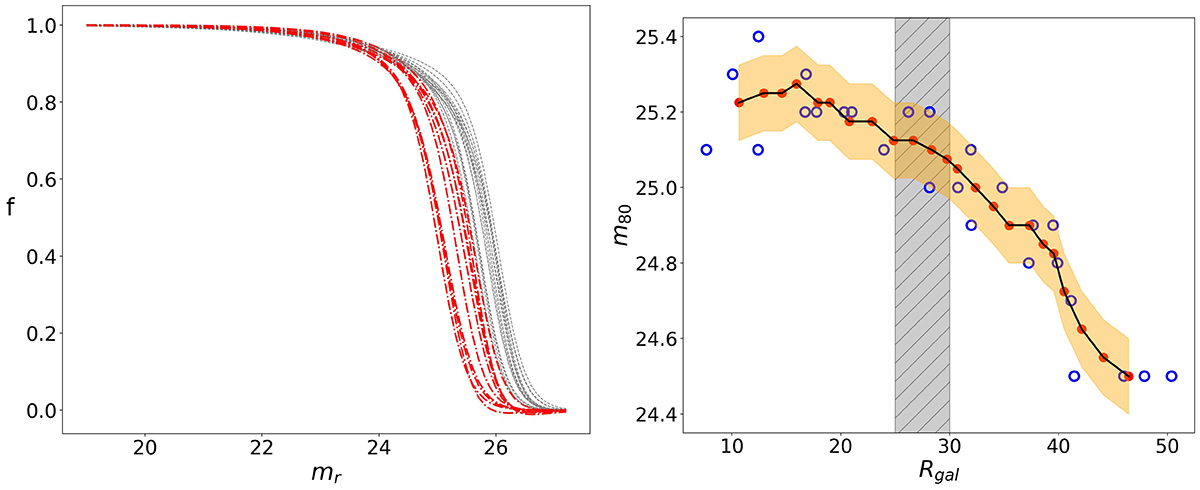
Completeness over the field. Left panel: Completeness functions for 26 off-galaxy regions at various galactocentric radii estimated in a region of 6 × 6 arcmin2 for the r-band. In red, all the regions with Rgal ≥ 30′, while functions at smaller galactocentric radii are plotted with gray lines. Right panel: radial trend of the interpolated 80% magnitude limit for each function. Blue open dots are the interpolated 80% magnitude limit for each region, while red dots are the values obtained through a running mean procedure with a window width of 4. The yellow region is ±0.1 mag around the red points.
Current usage metrics show cumulative count of Article Views (full-text article views including HTML views, PDF and ePub downloads, according to the available data) and Abstracts Views on Vision4Press platform.
Data correspond to usage on the plateform after 2015. The current usage metrics is available 48-96 hours after online publication and is updated daily on week days.
Initial download of the metrics may take a while.