Fig. 3.
Download original image
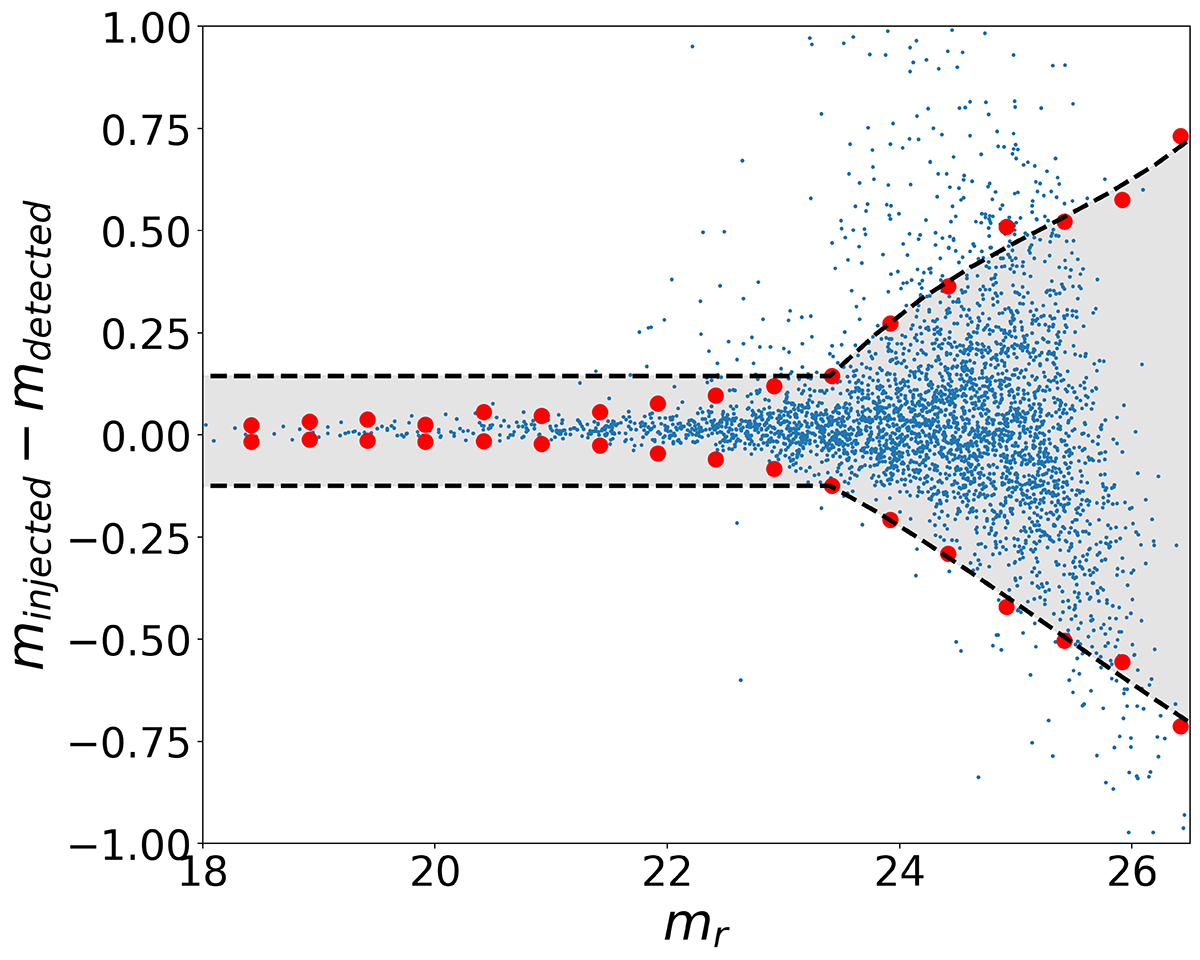
Adopted selection criteria for the injected sources used to estimate the completeness of the field in the r-band. Blue points represent the matched detected-injected sources in the field, while red dots indicate the median Δmag ± 2rmsMAD within each 0.5 magnitude bin. The black dashed line depicts the function adopted for source selection. All sources within the gray dashed region were selected for estimating the completeness function.
Current usage metrics show cumulative count of Article Views (full-text article views including HTML views, PDF and ePub downloads, according to the available data) and Abstracts Views on Vision4Press platform.
Data correspond to usage on the plateform after 2015. The current usage metrics is available 48-96 hours after online publication and is updated daily on week days.
Initial download of the metrics may take a while.