Open Access
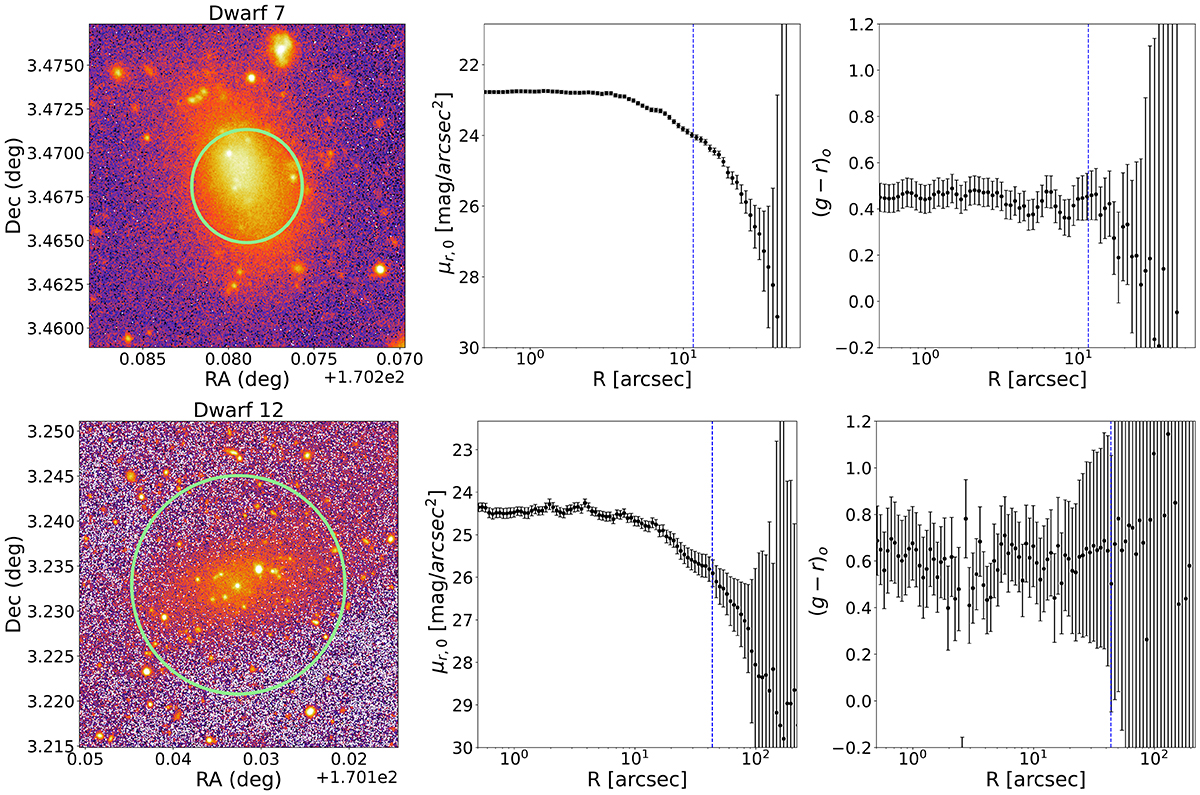
Fig. 22.
Download original image
Cutout around the identified dwarf galaxies in the r-band (left panel), the surface brightness profile (middle panel), and the color profile for two dwarf candidates in our sample (right panel). Green circles and the blue dashed line represent Re in the r-band reported in Table C.1.
Current usage metrics show cumulative count of Article Views (full-text article views including HTML views, PDF and ePub downloads, according to the available data) and Abstracts Views on Vision4Press platform.
Data correspond to usage on the plateform after 2015. The current usage metrics is available 48-96 hours after online publication and is updated daily on week days.
Initial download of the metrics may take a while.