Fig. 15.
Download original image
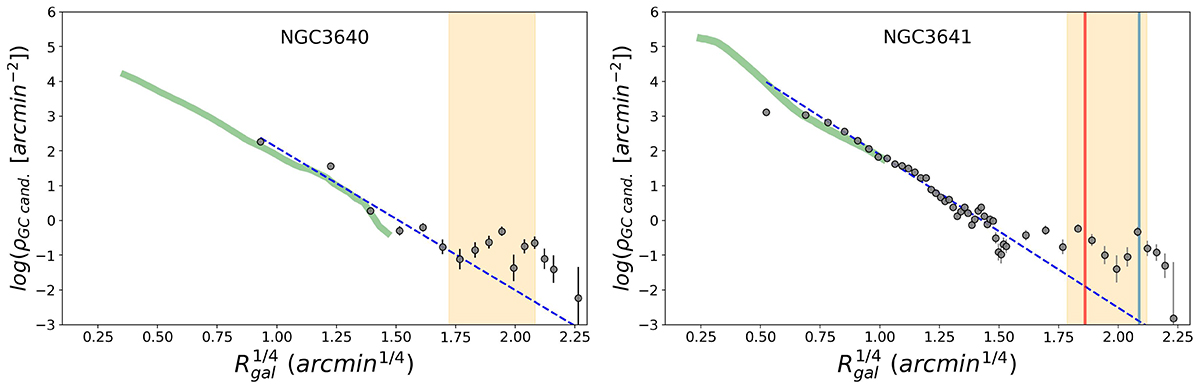
Background-subtracted radial distributions of GCs associated with NGC 3640 (left panel) and NGC 3641 (right panel), fitted with a R1/4 de Vaucouleurs profile. On the y-axis, the logarithm of the background-subtracted density profile is plotted against the fourth root of the galactocentric distance from each galaxy photocenter. The green shaded lines represent the surface brightness profile of the galaxy in the g-band with an arbitrary shift. The yellow shaded areas delineate a region in the density profiles likely associated with intra-group GCs. Light-blue and red vertical solid lines mark the distances where NGC 3630 and NGC 3643 are located, respectively.
Current usage metrics show cumulative count of Article Views (full-text article views including HTML views, PDF and ePub downloads, according to the available data) and Abstracts Views on Vision4Press platform.
Data correspond to usage on the plateform after 2015. The current usage metrics is available 48-96 hours after online publication and is updated daily on week days.
Initial download of the metrics may take a while.