Open Access
Fig. 13.
Download original image
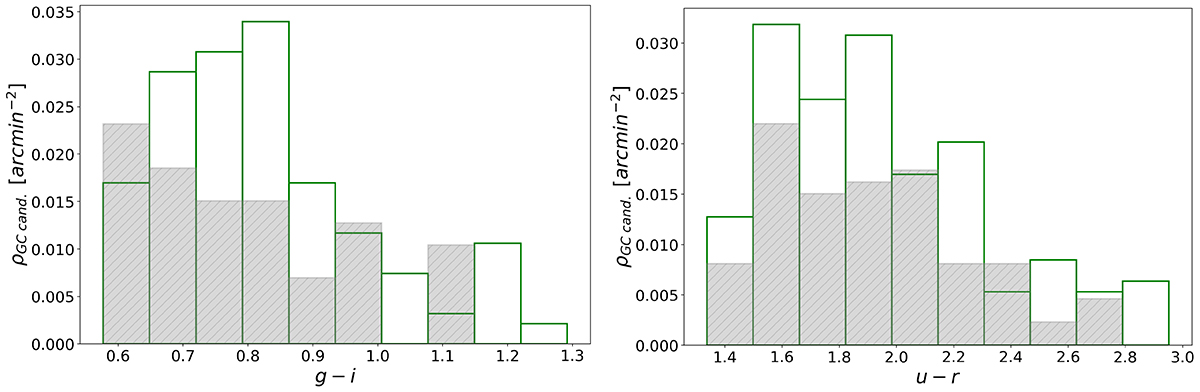
Color distribution of the GC candidates in the background region (25–30 arcmin, shaded gray bars) and in the plateau region (10–20 arcmin, green lines). The (g − i) distributions are shown in the left panel, while the (u − r) distributions are shown in the right panel.
Current usage metrics show cumulative count of Article Views (full-text article views including HTML views, PDF and ePub downloads, according to the available data) and Abstracts Views on Vision4Press platform.
Data correspond to usage on the plateform after 2015. The current usage metrics is available 48-96 hours after online publication and is updated daily on week days.
Initial download of the metrics may take a while.