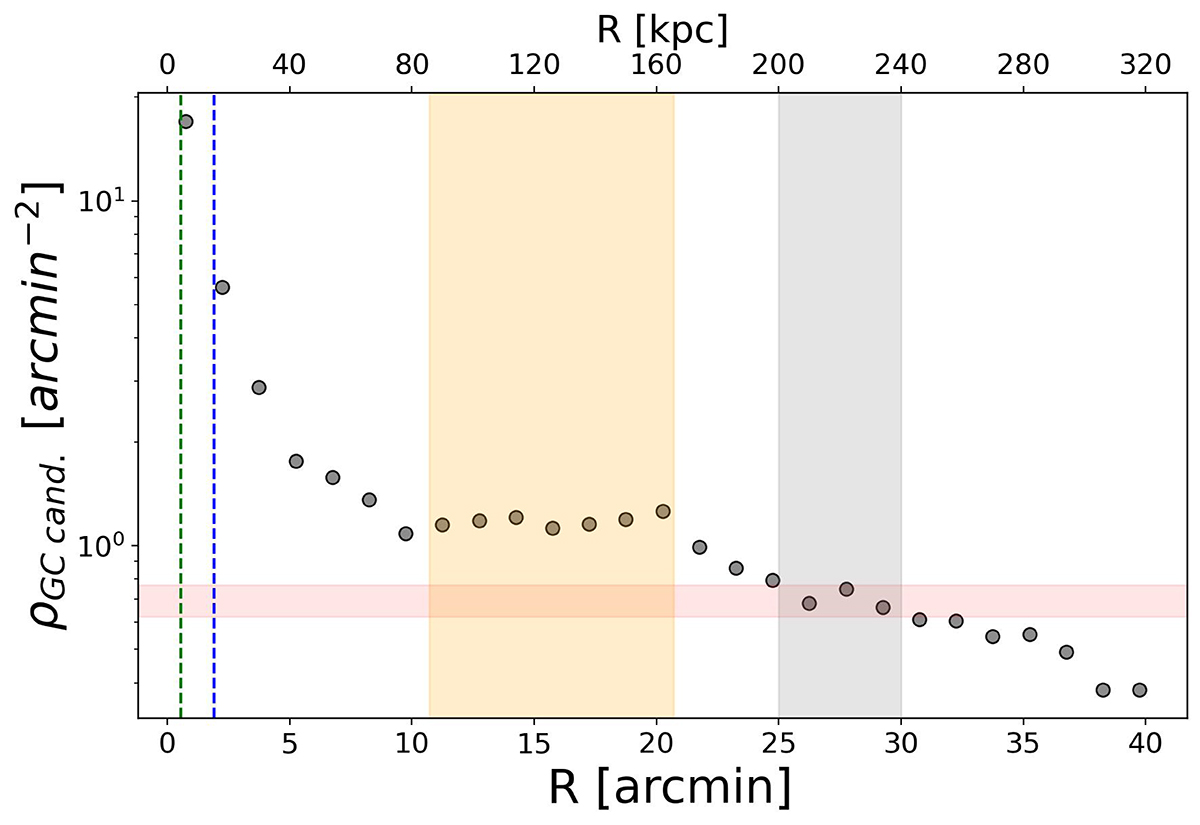
Fig. 12.
Download original image
Radial distribution of the global GC population plotted as the surface density vs. projected radial distance from NGC 3640 from the tangent point in Fig. 11. The y-axis is in logarithmic scale. The green and blue dashed line represent the location of NGC 3641 and NGC 3640, respectively. The gray shaded region shows the radial range used to estimate the residual contamination level. The red horizontal line is the 1σ background level. The yellow shaded region identifies the flat profile region likely associated with the intra-group GCs.
Current usage metrics show cumulative count of Article Views (full-text article views including HTML views, PDF and ePub downloads, according to the available data) and Abstracts Views on Vision4Press platform.
Data correspond to usage on the plateform after 2015. The current usage metrics is available 48-96 hours after online publication and is updated daily on week days.
Initial download of the metrics may take a while.