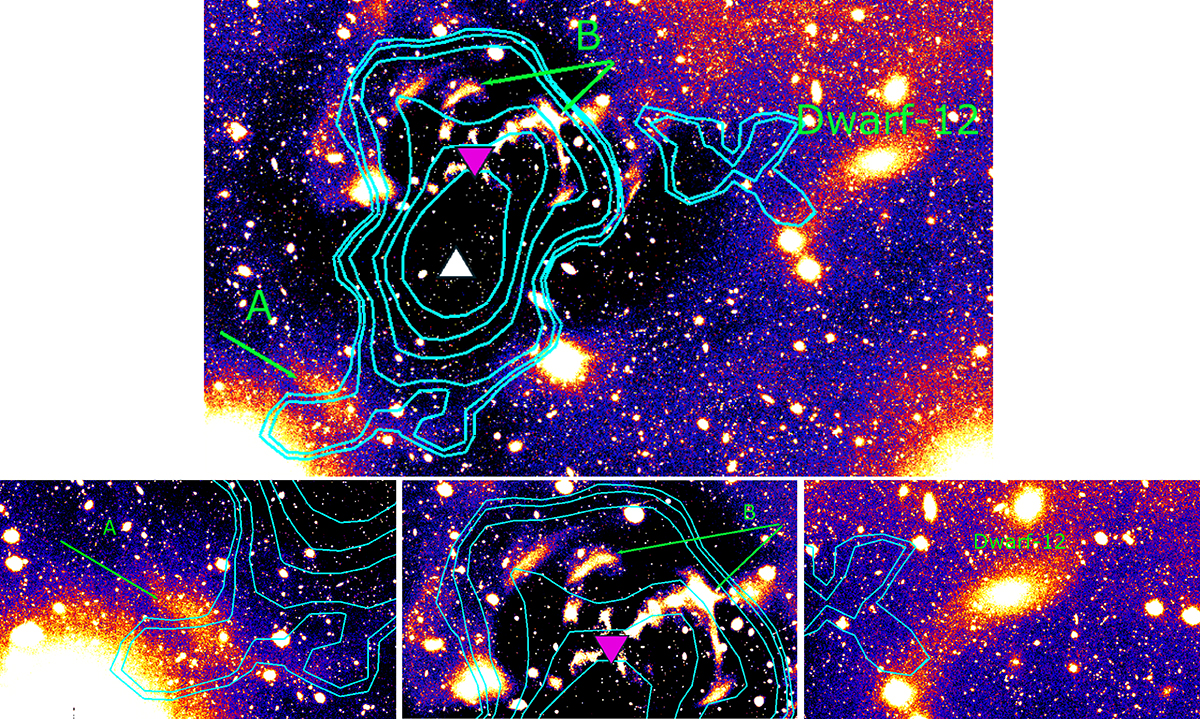
Fig. 10.
Download original image
Upper row: Cutout of 0.9 × 0.7 sq. degrees of the galaxy-subtracted image in the r-band. Light-blue contours are the isodensity contours extracted from the surface density map (see Fig. 9, left panel). Magenta and white triangles represent the center of NGC 3640 and NGC 3641, respectively. Green labels indicate the connection regions between GC population and LSB features described in Sect. 4.1. Label A points toward an LSB tail southeast of NGC3640; label B points to shell structures northwest of NGC3640. Lower row: Zoom-in on the three labeled regions.
Current usage metrics show cumulative count of Article Views (full-text article views including HTML views, PDF and ePub downloads, according to the available data) and Abstracts Views on Vision4Press platform.
Data correspond to usage on the plateform after 2015. The current usage metrics is available 48-96 hours after online publication and is updated daily on week days.
Initial download of the metrics may take a while.