Open Access
Fig. 5.
Download original image
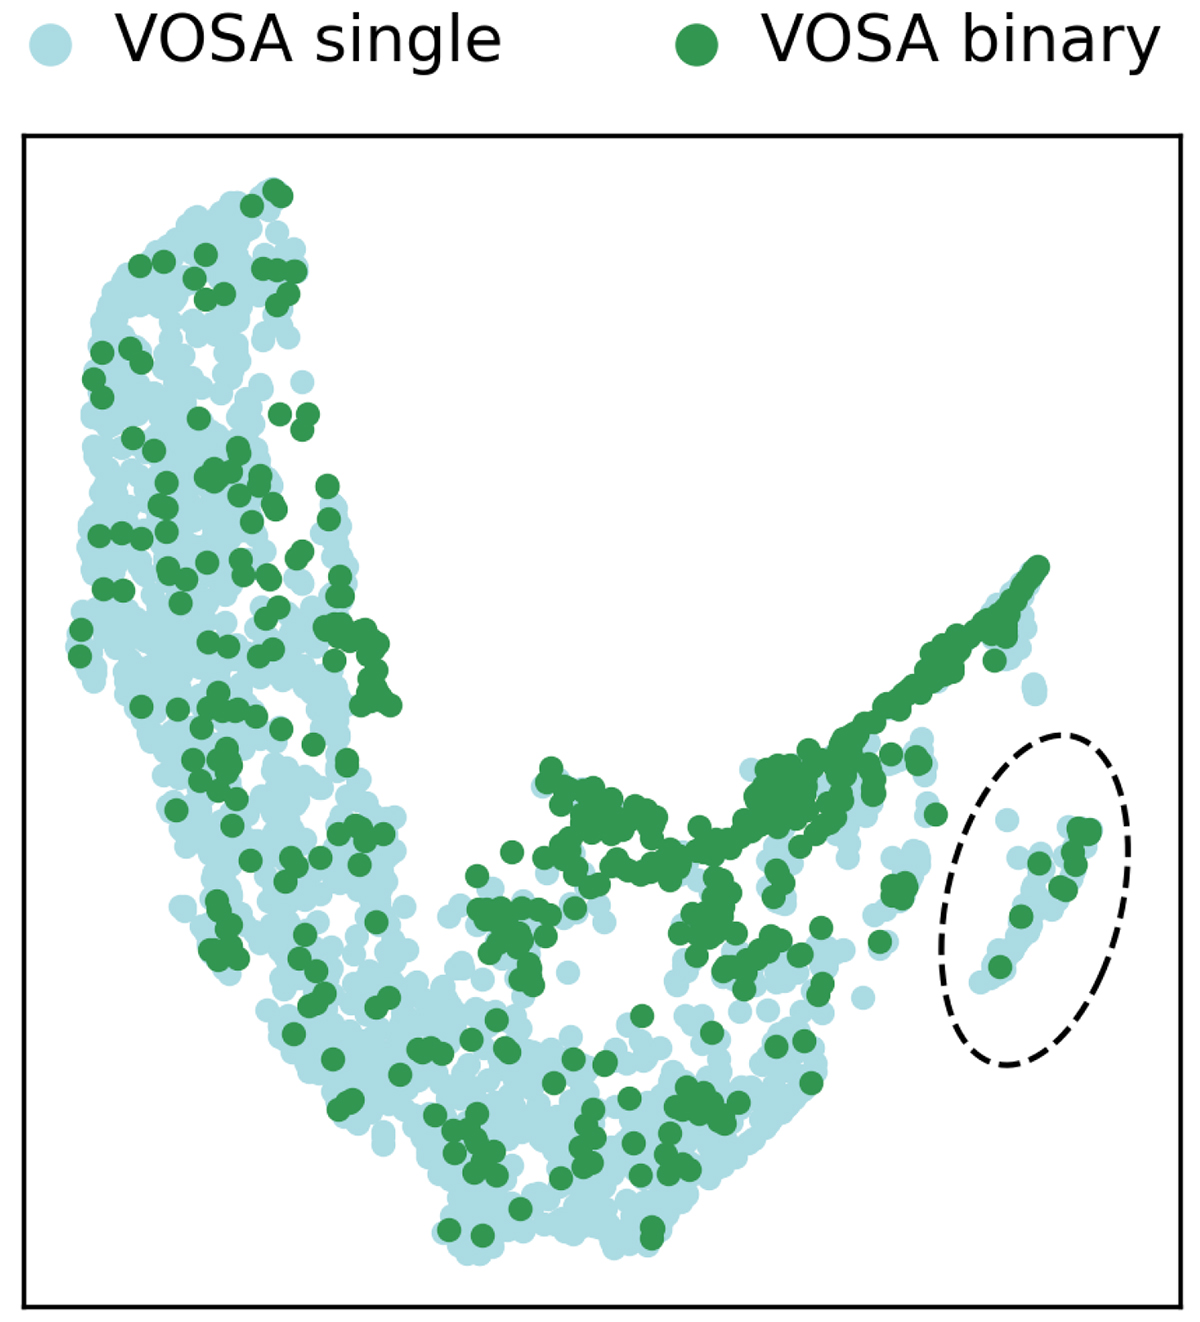
UMAP projection of our 2815 sample spectra. Every data point in the map represents a spectrum. The colours indicate whether the spectrum has been classified as single or binary by VOSA. The dashed ellipse marks the position of the 98 anomalous spectra in the projection. The axis dimensions have no direct physical meaning.
Current usage metrics show cumulative count of Article Views (full-text article views including HTML views, PDF and ePub downloads, according to the available data) and Abstracts Views on Vision4Press platform.
Data correspond to usage on the plateform after 2015. The current usage metrics is available 48-96 hours after online publication and is updated daily on week days.
Initial download of the metrics may take a while.