Open Access
Fig. 3.
Download original image
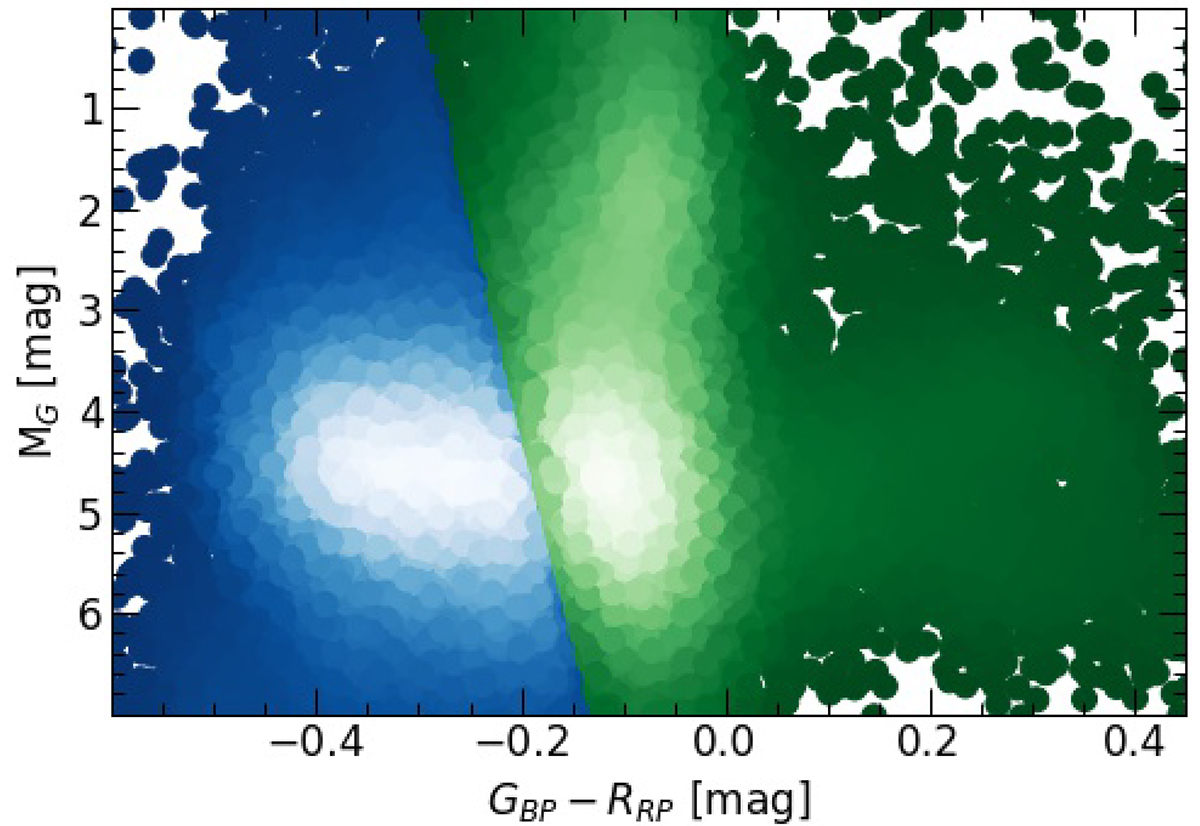
Colour-magnitude diagram with the sample of 39 800 hot subluminous star candidates selected in Gaia DR2 by Geier et al. (2019) using a linear w-SVM classification. The stars in blue correspond to a prediction of singles, and those in green to binaries. The data are coloured using a point density function.
Current usage metrics show cumulative count of Article Views (full-text article views including HTML views, PDF and ePub downloads, according to the available data) and Abstracts Views on Vision4Press platform.
Data correspond to usage on the plateform after 2015. The current usage metrics is available 48-96 hours after online publication and is updated daily on week days.
Initial download of the metrics may take a while.