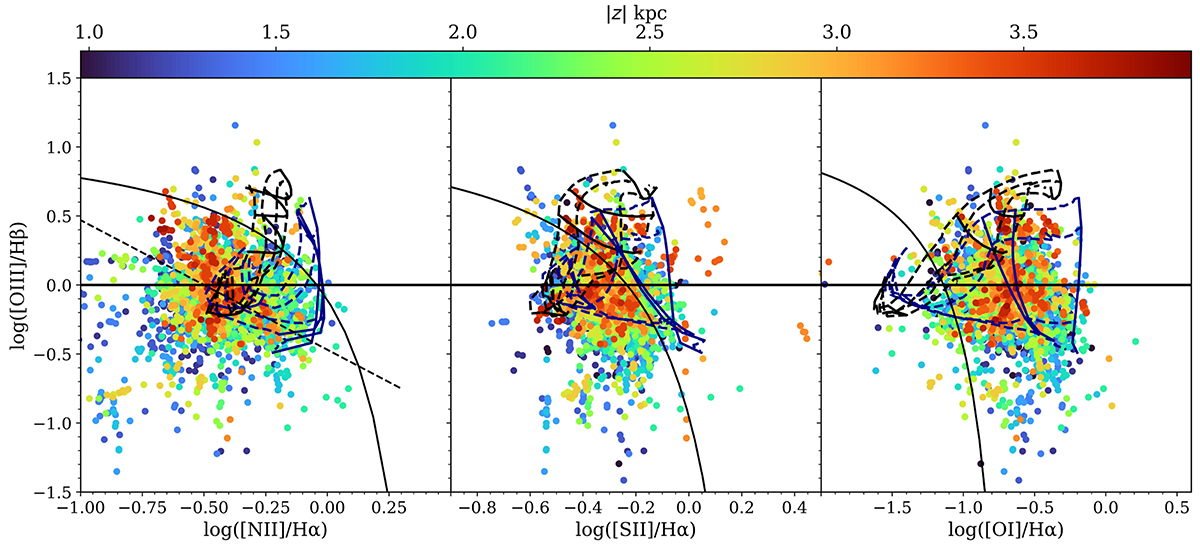
Fig. 7.
Download original image
BPT for all eDIG bins of IC1553, with the colours coding the vertical distance (both above and below) from the midplane. The plotted hybrid models correspond to 40% of the flux due to fast shocks with preionisation (curves lines) and with front shock only (blue curves), and 60% of the flux due to star formation with Z = Z⊙ and q = 107 cm/s. Solid curves correspond to the shock winds from 200 to 1000 km/s, and dashed curves represent magnetic field intensities from 0.0001 to 10 μG cm3/2. The Kopsacheili et al. (2020) and Kewley et al. (2001) lines are also plotted, as in Figure 6.
Current usage metrics show cumulative count of Article Views (full-text article views including HTML views, PDF and ePub downloads, according to the available data) and Abstracts Views on Vision4Press platform.
Data correspond to usage on the plateform after 2015. The current usage metrics is available 48-96 hours after online publication and is updated daily on week days.
Initial download of the metrics may take a while.