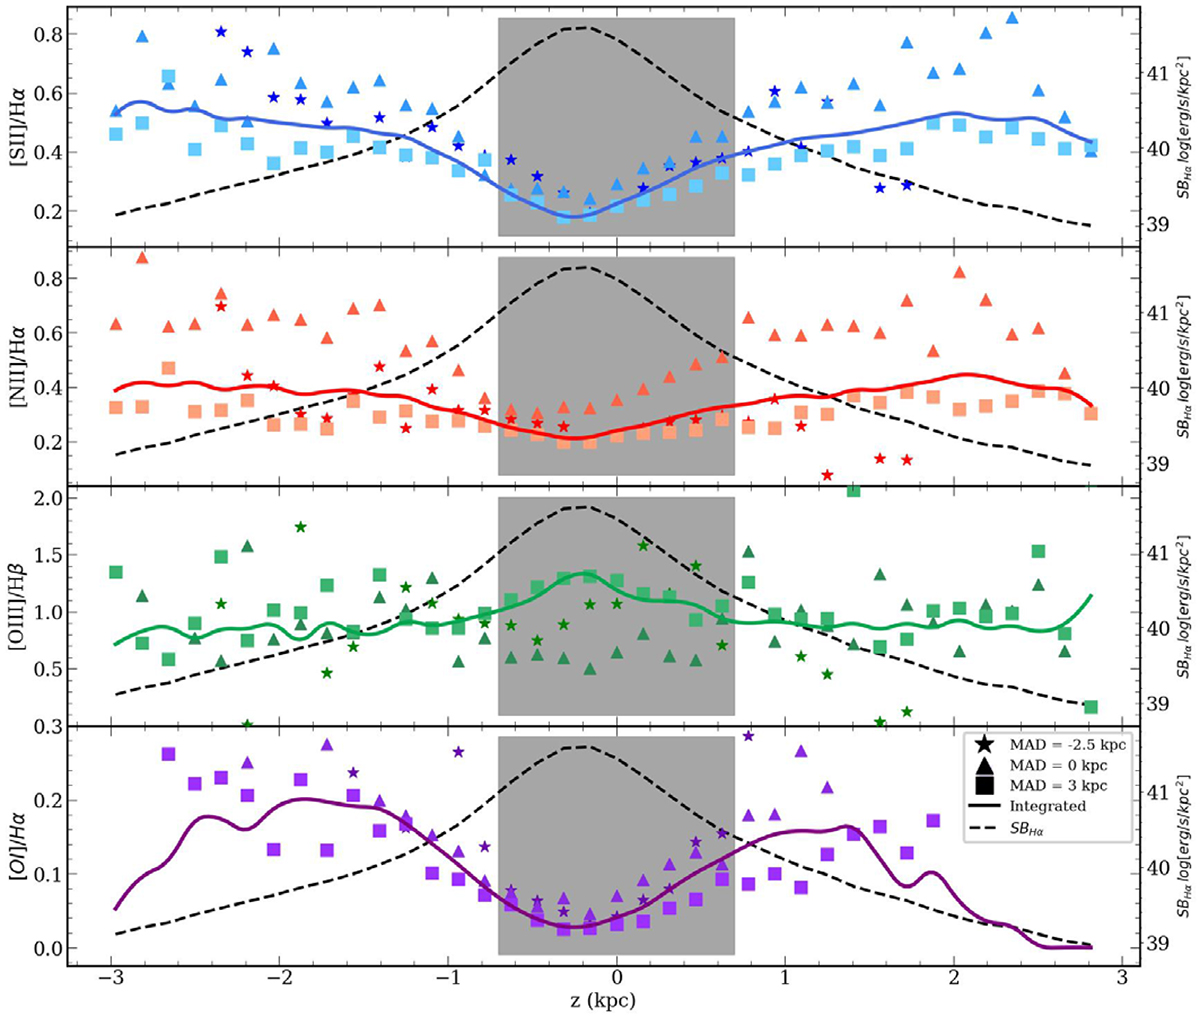
Fig. 3.
Download original image
Distribution of the line ratios with respect the distance from the midplane for the IC1553 galaxy. The star-shaped, triangular, and square markers represent the line ratio at that z for MAD = −2.5, 0, and 3 kpc, respectively, analogous to a long-slit perpendicular to the galactic plane at a given MAD. The solid lines represent the integrated values along the major axis distance. The dashed black line represents the ΣHα height distribution of the galaxy. The grey background between z = −0.7 kpc and 0.7 kpc represents the galactic plane.
Current usage metrics show cumulative count of Article Views (full-text article views including HTML views, PDF and ePub downloads, according to the available data) and Abstracts Views on Vision4Press platform.
Data correspond to usage on the plateform after 2015. The current usage metrics is available 48-96 hours after online publication and is updated daily on week days.
Initial download of the metrics may take a while.