Fig. 4.
Download original image
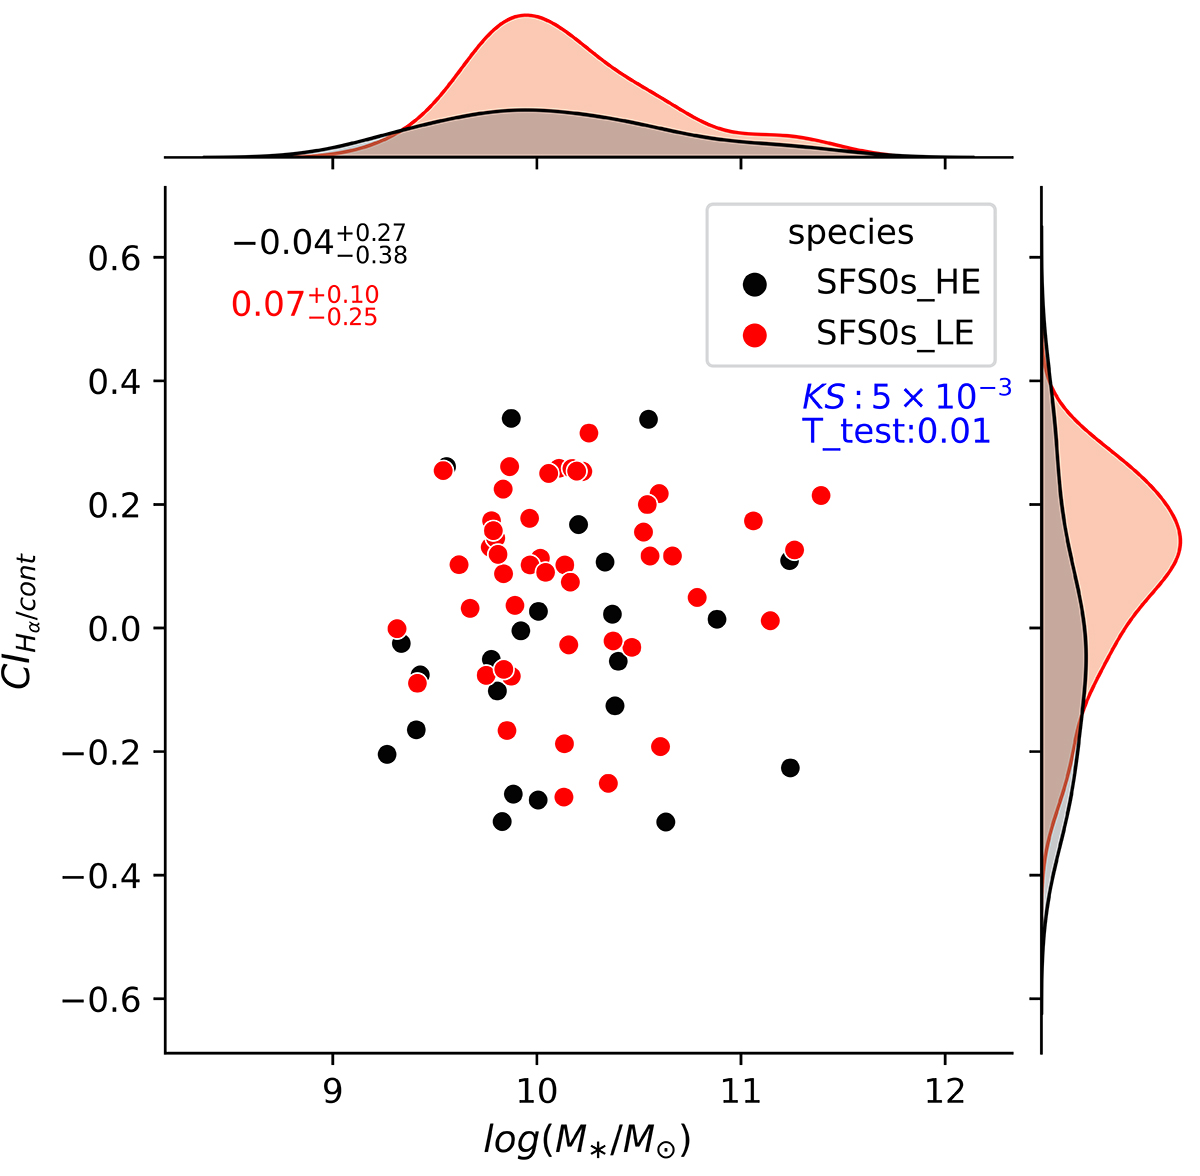
CIHα/cont values based on the concentration defined (Formula 8) from Wang et al. (2022) (black: SFS0s_HE; red: SFS0s_LE). The mean CIHα/cont of galaxies in HDEs and LDEs is ![]() and
and ![]() , respectively. The curves on the top and right illustrate the distributions of the parameters on the horizontal and vertical coordinates. The KS_test and T_test results are represented by the blue numbers.
, respectively. The curves on the top and right illustrate the distributions of the parameters on the horizontal and vertical coordinates. The KS_test and T_test results are represented by the blue numbers.
Current usage metrics show cumulative count of Article Views (full-text article views including HTML views, PDF and ePub downloads, according to the available data) and Abstracts Views on Vision4Press platform.
Data correspond to usage on the plateform after 2015. The current usage metrics is available 48-96 hours after online publication and is updated daily on week days.
Initial download of the metrics may take a while.