Open Access
Fig. 4
Download original image
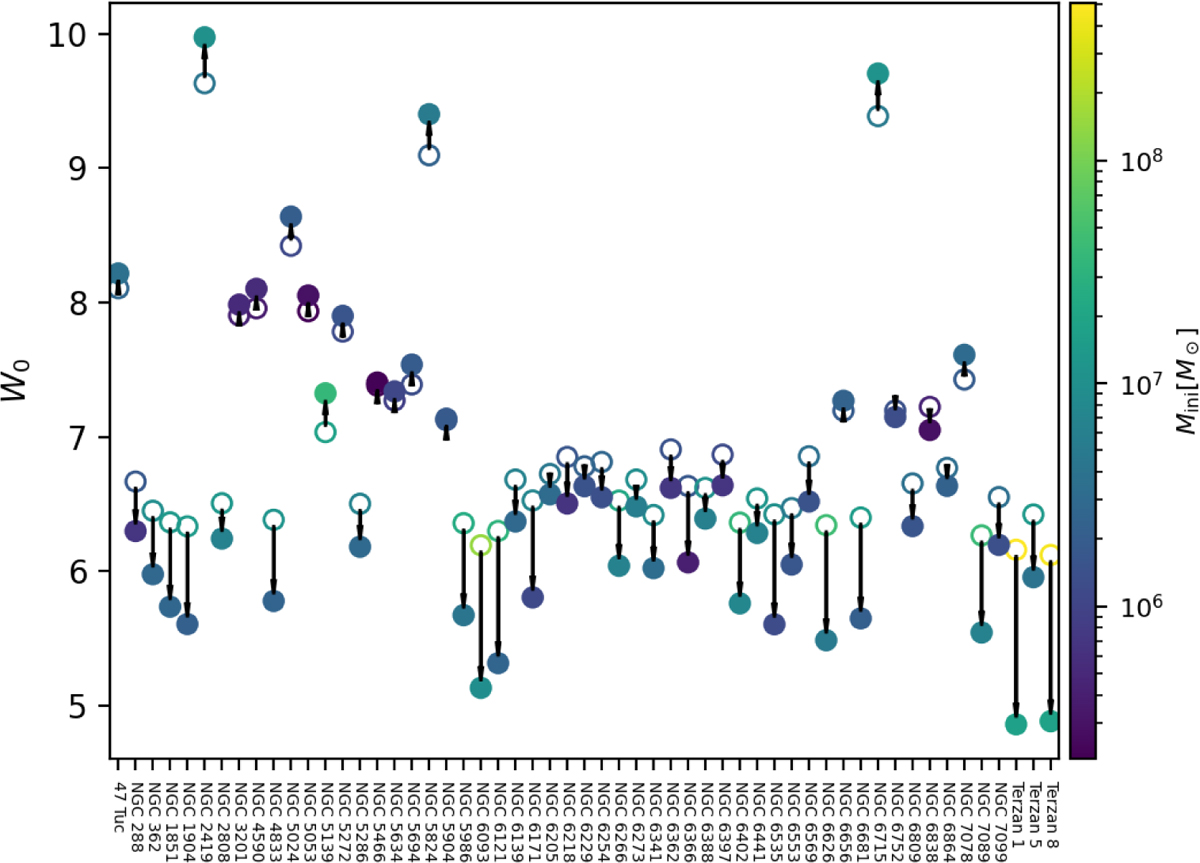
Old and new values for W0 for the GCs in our sample. The values from Wirth et al. (2022) are shown using an empty circle, the values for this paper using a filled circle. Both are colour-coded for the initial masses of the clusters and connected with an arrow pointing in the direction of the new value computed in this work.
Current usage metrics show cumulative count of Article Views (full-text article views including HTML views, PDF and ePub downloads, according to the available data) and Abstracts Views on Vision4Press platform.
Data correspond to usage on the plateform after 2015. The current usage metrics is available 48-96 hours after online publication and is updated daily on week days.
Initial download of the metrics may take a while.