Fig. 1
Download original image
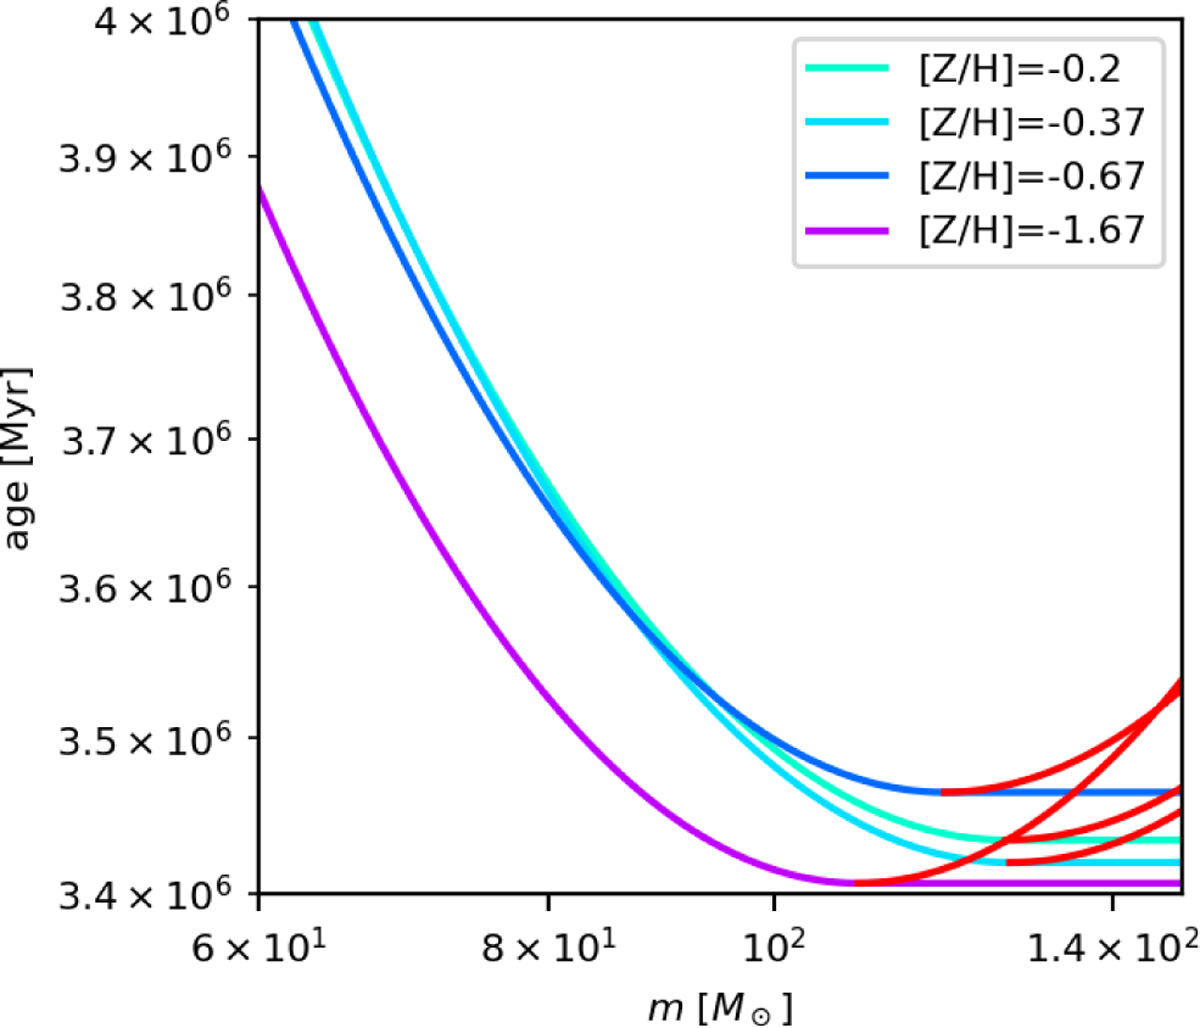
Stellar lifetimes over the stellar masses of high-mass stars according to Yan et al. (2019, see their Fig. 3). The areas in which stellar lifetimes increase with initial stellar mass are marked in red. Instead of following these increases, the stellar lifetimes are kept constant beyond the minimum as shown on the colours of the different graphs.
Current usage metrics show cumulative count of Article Views (full-text article views including HTML views, PDF and ePub downloads, according to the available data) and Abstracts Views on Vision4Press platform.
Data correspond to usage on the plateform after 2015. The current usage metrics is available 48-96 hours after online publication and is updated daily on week days.
Initial download of the metrics may take a while.