Fig. 7.
Download original image
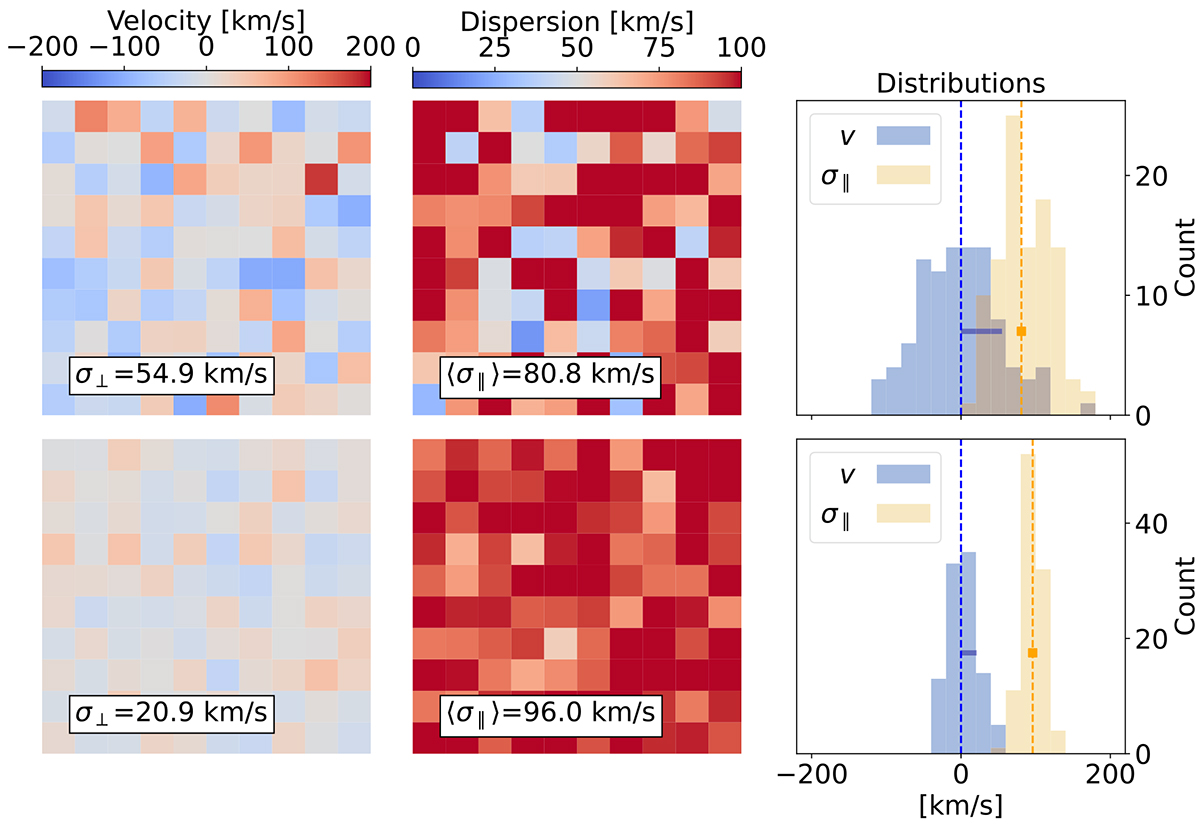
Kinematic model with N = 4 (upper row) and N = 25 clouds sampled per spaxel. In both cases the underlying velocity field distributes as ![]() . Left-hand column: Sampled velocities v (i.e., mean of N cloud velocities in the spaxel). Their standard deviation is the “transverse dispersion,” σ⊥. Middle column: Sampled standard deviations of the N cloud velocities, or “parallel” dispersion, σ∥. Right-hand column: Sample distribution of v and σ∥. The Horizontal blue line represents the same as in Fig. 3.
. Left-hand column: Sampled velocities v (i.e., mean of N cloud velocities in the spaxel). Their standard deviation is the “transverse dispersion,” σ⊥. Middle column: Sampled standard deviations of the N cloud velocities, or “parallel” dispersion, σ∥. Right-hand column: Sample distribution of v and σ∥. The Horizontal blue line represents the same as in Fig. 3.
Current usage metrics show cumulative count of Article Views (full-text article views including HTML views, PDF and ePub downloads, according to the available data) and Abstracts Views on Vision4Press platform.
Data correspond to usage on the plateform after 2015. The current usage metrics is available 48-96 hours after online publication and is updated daily on week days.
Initial download of the metrics may take a while.