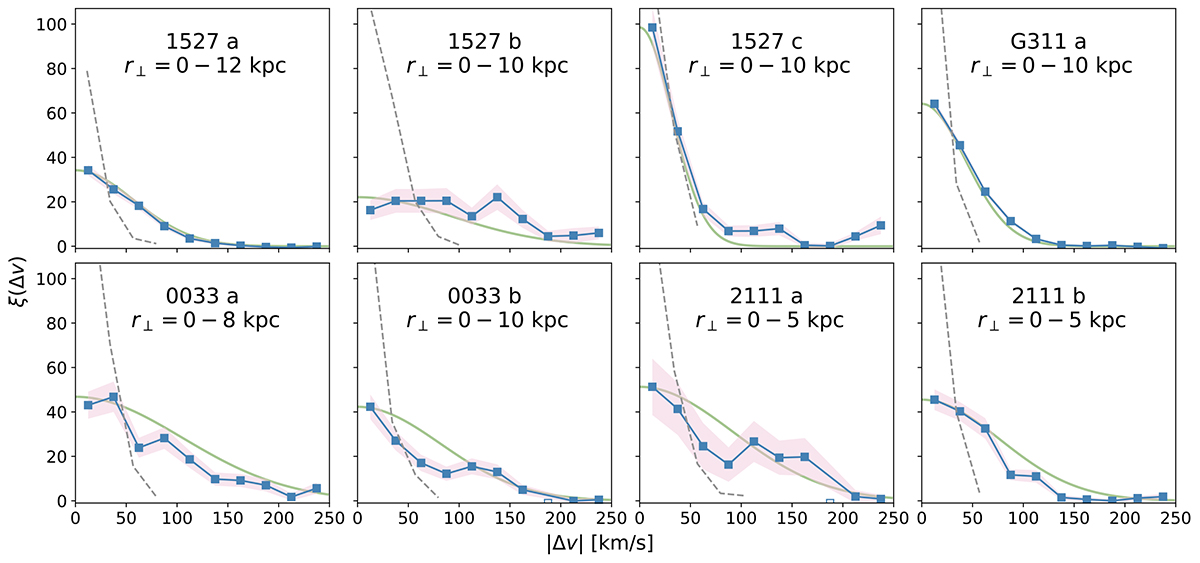
Fig. 6.
Download original image
Velocity projection of ξ(Δr⊥, Δv). Blue squares represent the arc data. The 1σ errors (in pink) include both the bootstrapping analysis and the Poisson statistics described in Sect. 6.3 but are dominated by the latter. Dashed curves indicate the signal produced by a velocity field distributed as ![]() , where δv are the individual measurement errors. Green curves show the model prediction (Sect. 7.2.4).
, where δv are the individual measurement errors. Green curves show the model prediction (Sect. 7.2.4).
Current usage metrics show cumulative count of Article Views (full-text article views including HTML views, PDF and ePub downloads, according to the available data) and Abstracts Views on Vision4Press platform.
Data correspond to usage on the plateform after 2015. The current usage metrics is available 48-96 hours after online publication and is updated daily on week days.
Initial download of the metrics may take a while.