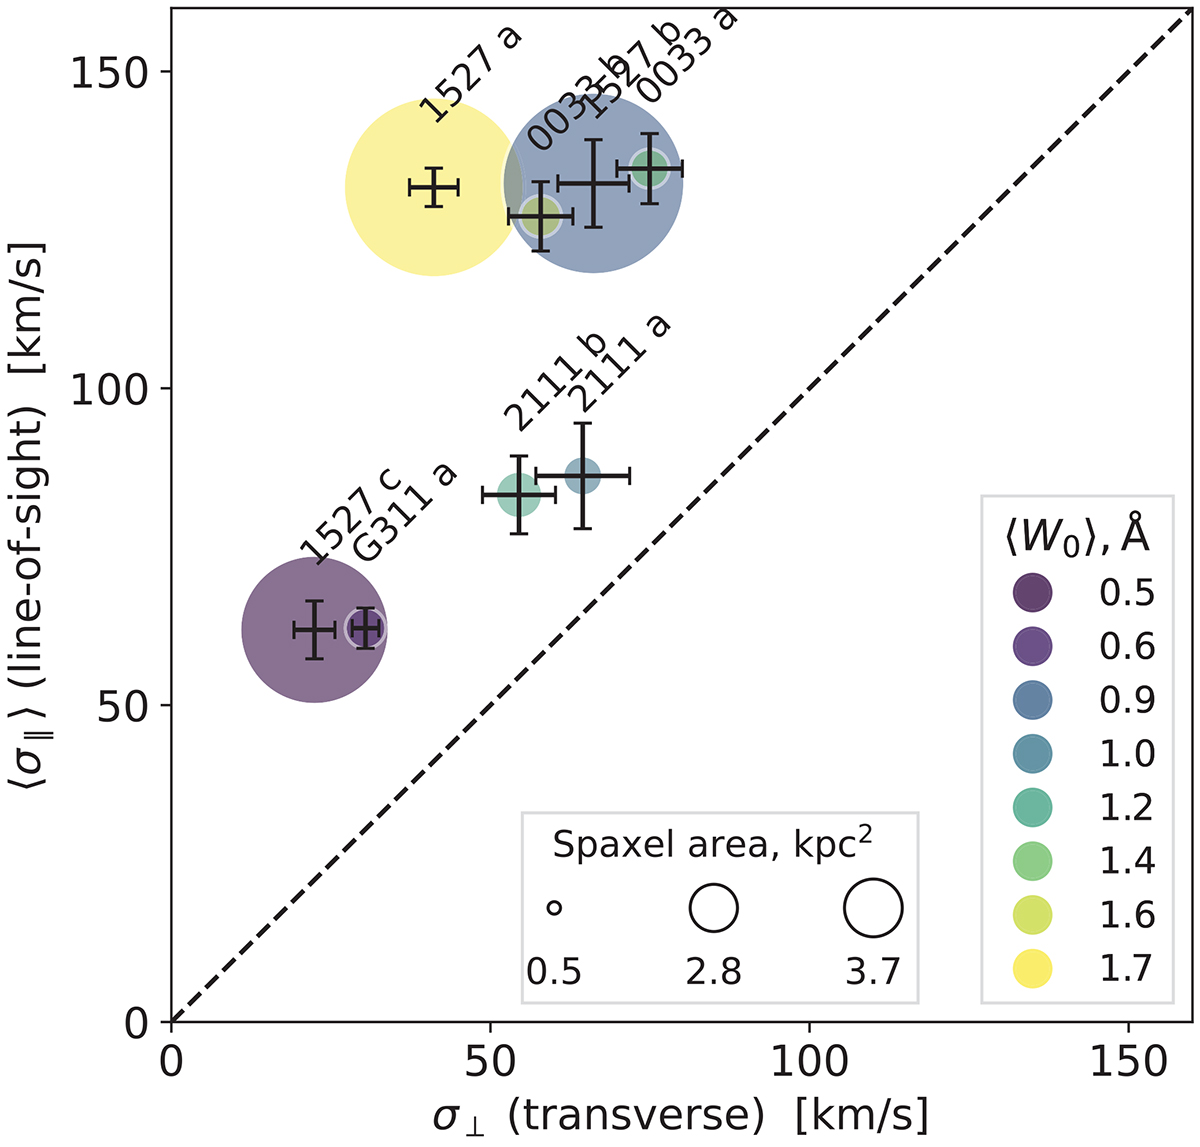
Fig. 4.
Download original image
System-by-system median absorption spread versus transverse velocity dispersion. Errors result from a bootstrapping analysis (Sect. 5). Circle areas are proportional to the absorber-plane mean spaxel area (in square kiloparsecs), and colors indicate the median rest-frame equivalent width per system (in Å). σ∥ has been corrected for the instrumental profile width (Sect. 5), and σ⊥ has been corrected for the spurious dispersion induced by each system’s S/N selection function (Appendix D).
Current usage metrics show cumulative count of Article Views (full-text article views including HTML views, PDF and ePub downloads, according to the available data) and Abstracts Views on Vision4Press platform.
Data correspond to usage on the plateform after 2015. The current usage metrics is available 48-96 hours after online publication and is updated daily on week days.
Initial download of the metrics may take a while.