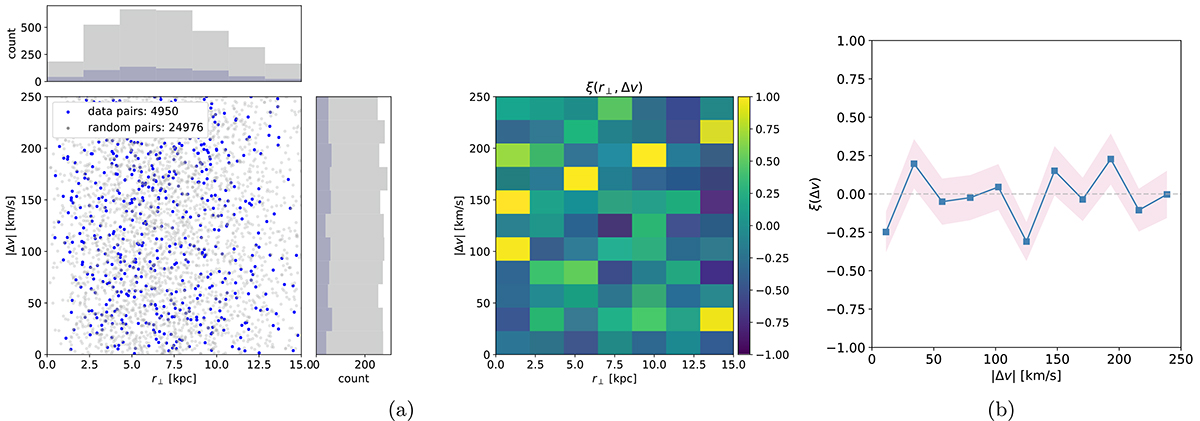
Fig. F.1.
Download original image
ξ(Δr⊥, Δv) measured for a realistic mock data set with no correlation. (a) In the scatter plot the blue (gray) dots correspond to the mock data (random) pairs, and the side panels show the respective projections in number counts. In the 2d-histogram the color scale indicates ξ(Δr⊥, Δv) between -1 and 1. (b) Velocity projection of ξ(Δr⊥, Δv). The shaded pink regions indicate 1σ errors.
Current usage metrics show cumulative count of Article Views (full-text article views including HTML views, PDF and ePub downloads, according to the available data) and Abstracts Views on Vision4Press platform.
Data correspond to usage on the plateform after 2015. The current usage metrics is available 48-96 hours after online publication and is updated daily on week days.
Initial download of the metrics may take a while.