Fig. 10.
Download original image
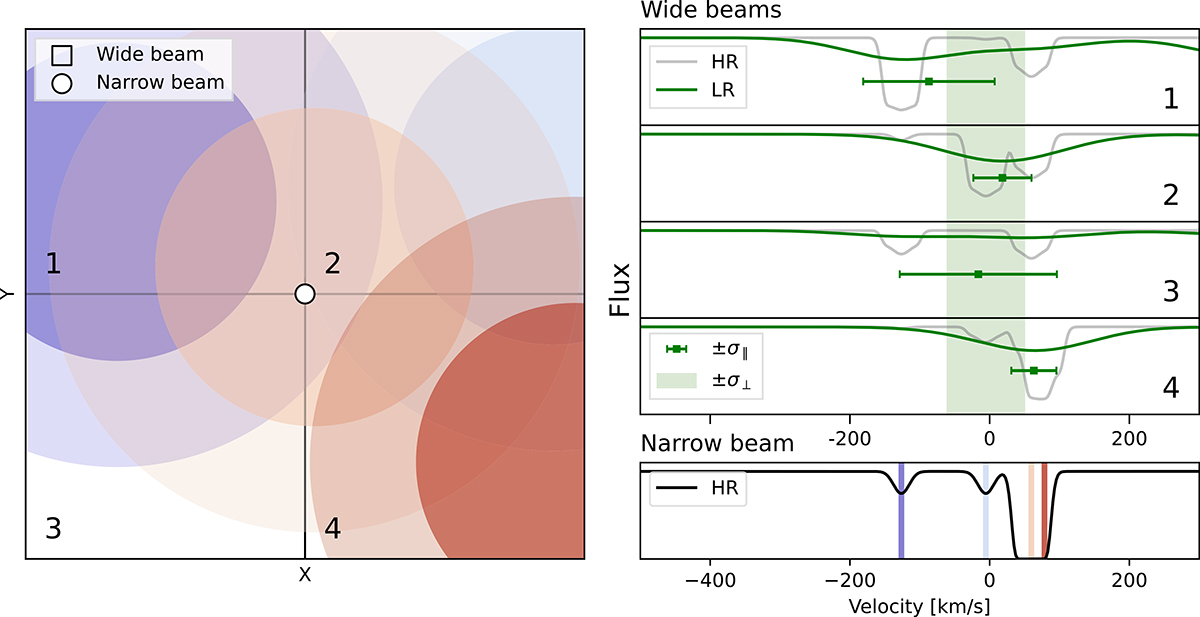
Semi-schematic visualization of the kinematic model. Left-hand panel: Column density map, N(x). Here, x denotes the on-sky position. The map was created by superposing four clouds with ![]() cm−2 (cores) and 1012 cm−2 (halos) at random positions and line-of-sight velocities, vc. The clouds are colored according to vc. The white dot represents a narrow beam (e.g., a quasar pencil beam), and the four squares indicate wide beams (e.g., ARCTOMO spaxels). An optical-depth cube τ(v, x) was created by evaluating Voigt profiles (Liang & Kravtsov 2017) with v = vc, N = N(x), and b = 10 km s−1, and spectra were generated by averaging e−τ within the beam area. Upper right panels: Wide-beam spectra at infinite and MUSE spectral resolution (HR and LR, respectively). The green squared symbols with error bars indicate LR individual line velocity centroids and σ∥ dispersions, respectively, obtained from Gaussian fits. The shaded region indicates the overall σ⊥ dispersion of the four LR velocities. Lower right panel: Narrow-beam spectrum at infinite spectral resolution. We note that vc is indicated with the same colors as in the left-hand panel.
cm−2 (cores) and 1012 cm−2 (halos) at random positions and line-of-sight velocities, vc. The clouds are colored according to vc. The white dot represents a narrow beam (e.g., a quasar pencil beam), and the four squares indicate wide beams (e.g., ARCTOMO spaxels). An optical-depth cube τ(v, x) was created by evaluating Voigt profiles (Liang & Kravtsov 2017) with v = vc, N = N(x), and b = 10 km s−1, and spectra were generated by averaging e−τ within the beam area. Upper right panels: Wide-beam spectra at infinite and MUSE spectral resolution (HR and LR, respectively). The green squared symbols with error bars indicate LR individual line velocity centroids and σ∥ dispersions, respectively, obtained from Gaussian fits. The shaded region indicates the overall σ⊥ dispersion of the four LR velocities. Lower right panel: Narrow-beam spectrum at infinite spectral resolution. We note that vc is indicated with the same colors as in the left-hand panel.
Current usage metrics show cumulative count of Article Views (full-text article views including HTML views, PDF and ePub downloads, according to the available data) and Abstracts Views on Vision4Press platform.
Data correspond to usage on the plateform after 2015. The current usage metrics is available 48-96 hours after online publication and is updated daily on week days.
Initial download of the metrics may take a while.